Baseball is a sport of inches - one half inch here and a fly out turns into a home run, one half inch there and a liner turns into a double play. Timing is also critical - striking with runners on and in scoring position is so much more valuable than a parade of solo home runs. In 2013, the St. Louis Cardinals were able to capitalize on this more than any other team in baseball history, riding a 0.330 batting average with runners in scoring position (RISP) to a 97-win season and World Series appearance.
Watching the Red Sox crush my Nationals last weekend, and seeing how well they executed with RISP, made me curious to see what the numbers look like so far this year. Spoiler - while the Sox don’t quite match up to the 2013 Cardinals, the numbers certainly bode well for them.
Batting Average with RISP
Top 5 Teams by Average
| Team | Average with RISP |
|---|---|
| Boston Red Sox | 0.284 |
| Atlanta Braves | 0.280 |
| Houston Astros | 0.278 |
| Colorado Rockies | 0.269 |
| Oakland Athletics | 0.264 |
Bottom 5 Teams by Average
| Team | Average with RISP |
|---|---|
| Baltimore Orioles | 0.214 |
| Kansas City Royals | 0.217 |
| New York Mets | 0.226 |
| Texas Rangers | 0.229 |
| Milwaukee Brewers | 0.232 |
No surprises here - the Red Sox and Astros are two of the best teams in baseball, and seeing the bottom-dwelling Orioles at the bottom of the charts is no surprise to anyone who has seen Chris Davis at the plate this year.
Going Deeper into RISP
While looking at RISP batting average is useful, there are two major flaws with this approach:
- On-Base Plus Slugging (OPS) is a better metric into the actual batting performance of players than pure batting average
- There isn’t any control for season averages - tough to tell whether a given statistic is better or worse than the team’s overall batting numbers
With these factors in mind, I did a bit more analysis of the numbers:
- Using OPS as the statistic of record
- Controlling for each team’s performance by calculating the differential for OPS with RISP versus the team’s average OPS for the year
Top 5 Teams by OPS
| Team | OPS with RISP |
|---|---|
| Boston Red Sox | 0.864 |
| Atlanta Braves | 0.854 |
| Houston Astros | 0.837 |
| Cleveland Indians | 0.789 |
| Philadelphia Phillies | 0.783 |
Bottom 5 Teams by OPS
| Team | OPS with RISP |
|---|---|
| Kansas City Royals | 0.622 |
| Baltimore Orioles | 0.631 |
| Tampa Bay Rays | 0.663 |
| Detroit Tigers | 0.672 |
| St. Louis Cardinals | 0.689 |
Top 5 Teams by OPS Differential
These teams have all hit better with runners in scoring position than in non-RISP batting situations.
| Name | Difference in AVG | Difference in OPS |
|---|---|---|
| Atlanta Braves | 0.021 | 0.103 |
| Boston Red Sox | 0.018 | 0.077 |
| Minnesota Twins | 0.022 | 0.071 |
| Philadelphia Phillies | 0.013 | 0.072 |
| San Diego Padres | 0.026 | 0.078 |
Bottom 5 Teams by OPS Differential
These teams have all hit worse with runners in scoring position than in non-RISP batting situations.
| Team | Difference in AVG | Difference in OPS |
|---|---|---|
| Baltimore Orioles | -0.012 | -0.037 |
| Chicago Cubs | -0.012 | -0.035 |
| Kansas City Royals | -0.02 | -0.039 |
| Seattle Mariners | -0.01 | -0.038 |
| Tampa Bay Rays | -0.016 | -0.04 |
Takeways
Batting performance with runners in scoring position is often viewed as a loose proxy for clutchness - if there’s any time to focus up and drive in a runner, it’s certainly with men on second and third. As a former baseball player, I’m sympathetic to this argument. However, the truth of the matter is that it’s hard to show that “clutchness” (in this case proxied by the statistic diffOPS) necessarily leads to more wins as a baseball club.
Indeed, when you run a linear regression in R on Wins and diffOPS, the adjusted R2 value is 0.02313, which means that “clutchness”, as measured by diffOPS, explains practically no information about a given team’s win total.
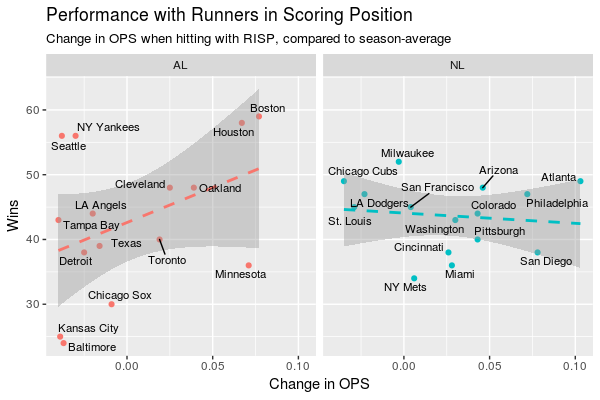
Further evidence to this point can be seen in the graphic below, where the AL and NL have offsetting trends in how diffOPS and Wins are related. Indeed, a p-value of 0.2046 tells us that there is no statistical significance to using diffOPS as an explainer for runs.
Finally, it’s important to remember how important regression to the mean is for any statistic like this, where the performance of a sample of events may vary significantly from the performance of all of the events. Even the mighty 2013 Cardinals, who set the Major League record for batting with RISP, where cut back down to size by Mother Regression, following up their 0.330 season with a 0.254 performance.
In the end, it’s fun for fans and announcers to track and discuss novelty statistics such as batting average and OPS when hitting with runners in scoring position. Just don’t worry too much about whether you team is at the top of bottom of the list, because in the end, it all balances out. Clutchness may still be real, it just isn’t reasonable to apply it to all RISP situations.