For about the last month, there’s been a new addition to my daily routine. At some point in the afternoon, I find a comfy spot to sit, fire up Wordle, drop in a first guess, and then let my mind slowly run through vowels and consonants…
Delightfully low-tech and easy to play, yet occasionally fiendishly difficult, it’s easy to see how Wordle quickly became a phenomenon amongst the NYT Crossword and Trivia Night set.
One of the most fun aspects of Wordle is it’s easy sharing of your guess patterns as a matrix of emojis - letting you brag to your friends about a particularly quick solve, or bemoan how long it took you to catch on to the repeated Ls in KNOLL.
Given that this is a Data blog, I thought it would be fun to try to figure out how “good” the public is at Wordle, and if there is enough difference between words that we can easily pick out the easy and hard ones from the crowd.
Aggregating Wordle Results
With those goals in mind, I turned to Twitter - the data source I felt had the best combination of high Wordle post volume and accessibility. Using the Recent Search API, which provides a 7-day searchable lookback of Tweets, I spent the last few days crawling Tweets shared in the characteristic “Wordle” sharing format: Wordle 232 4/6, followed by a trail of emojis.
For those curious, here’s a helper function I built to make querying each Wordle day’s Tweets a lot easier:
URL = "https://api.twitter.com/2/tweets/search/recent"

def search_tweets(day, pagination_token = None):
  query = '-is:retweet -is:reply lang:en "Wordle {}" "/6"'.format(day)
  params = {'query' : query, 'max_results' : 100, 'sort_order' : 'relevancy'}
  if pagination_token is not None:
    params['pagination_token'] = pagination_token
  # sending get request and saving the response as response object
  r = requests.get(url = URL, headers = HEADERS, params = params)
  # extracting data in json format
  data = r.json()
  return data
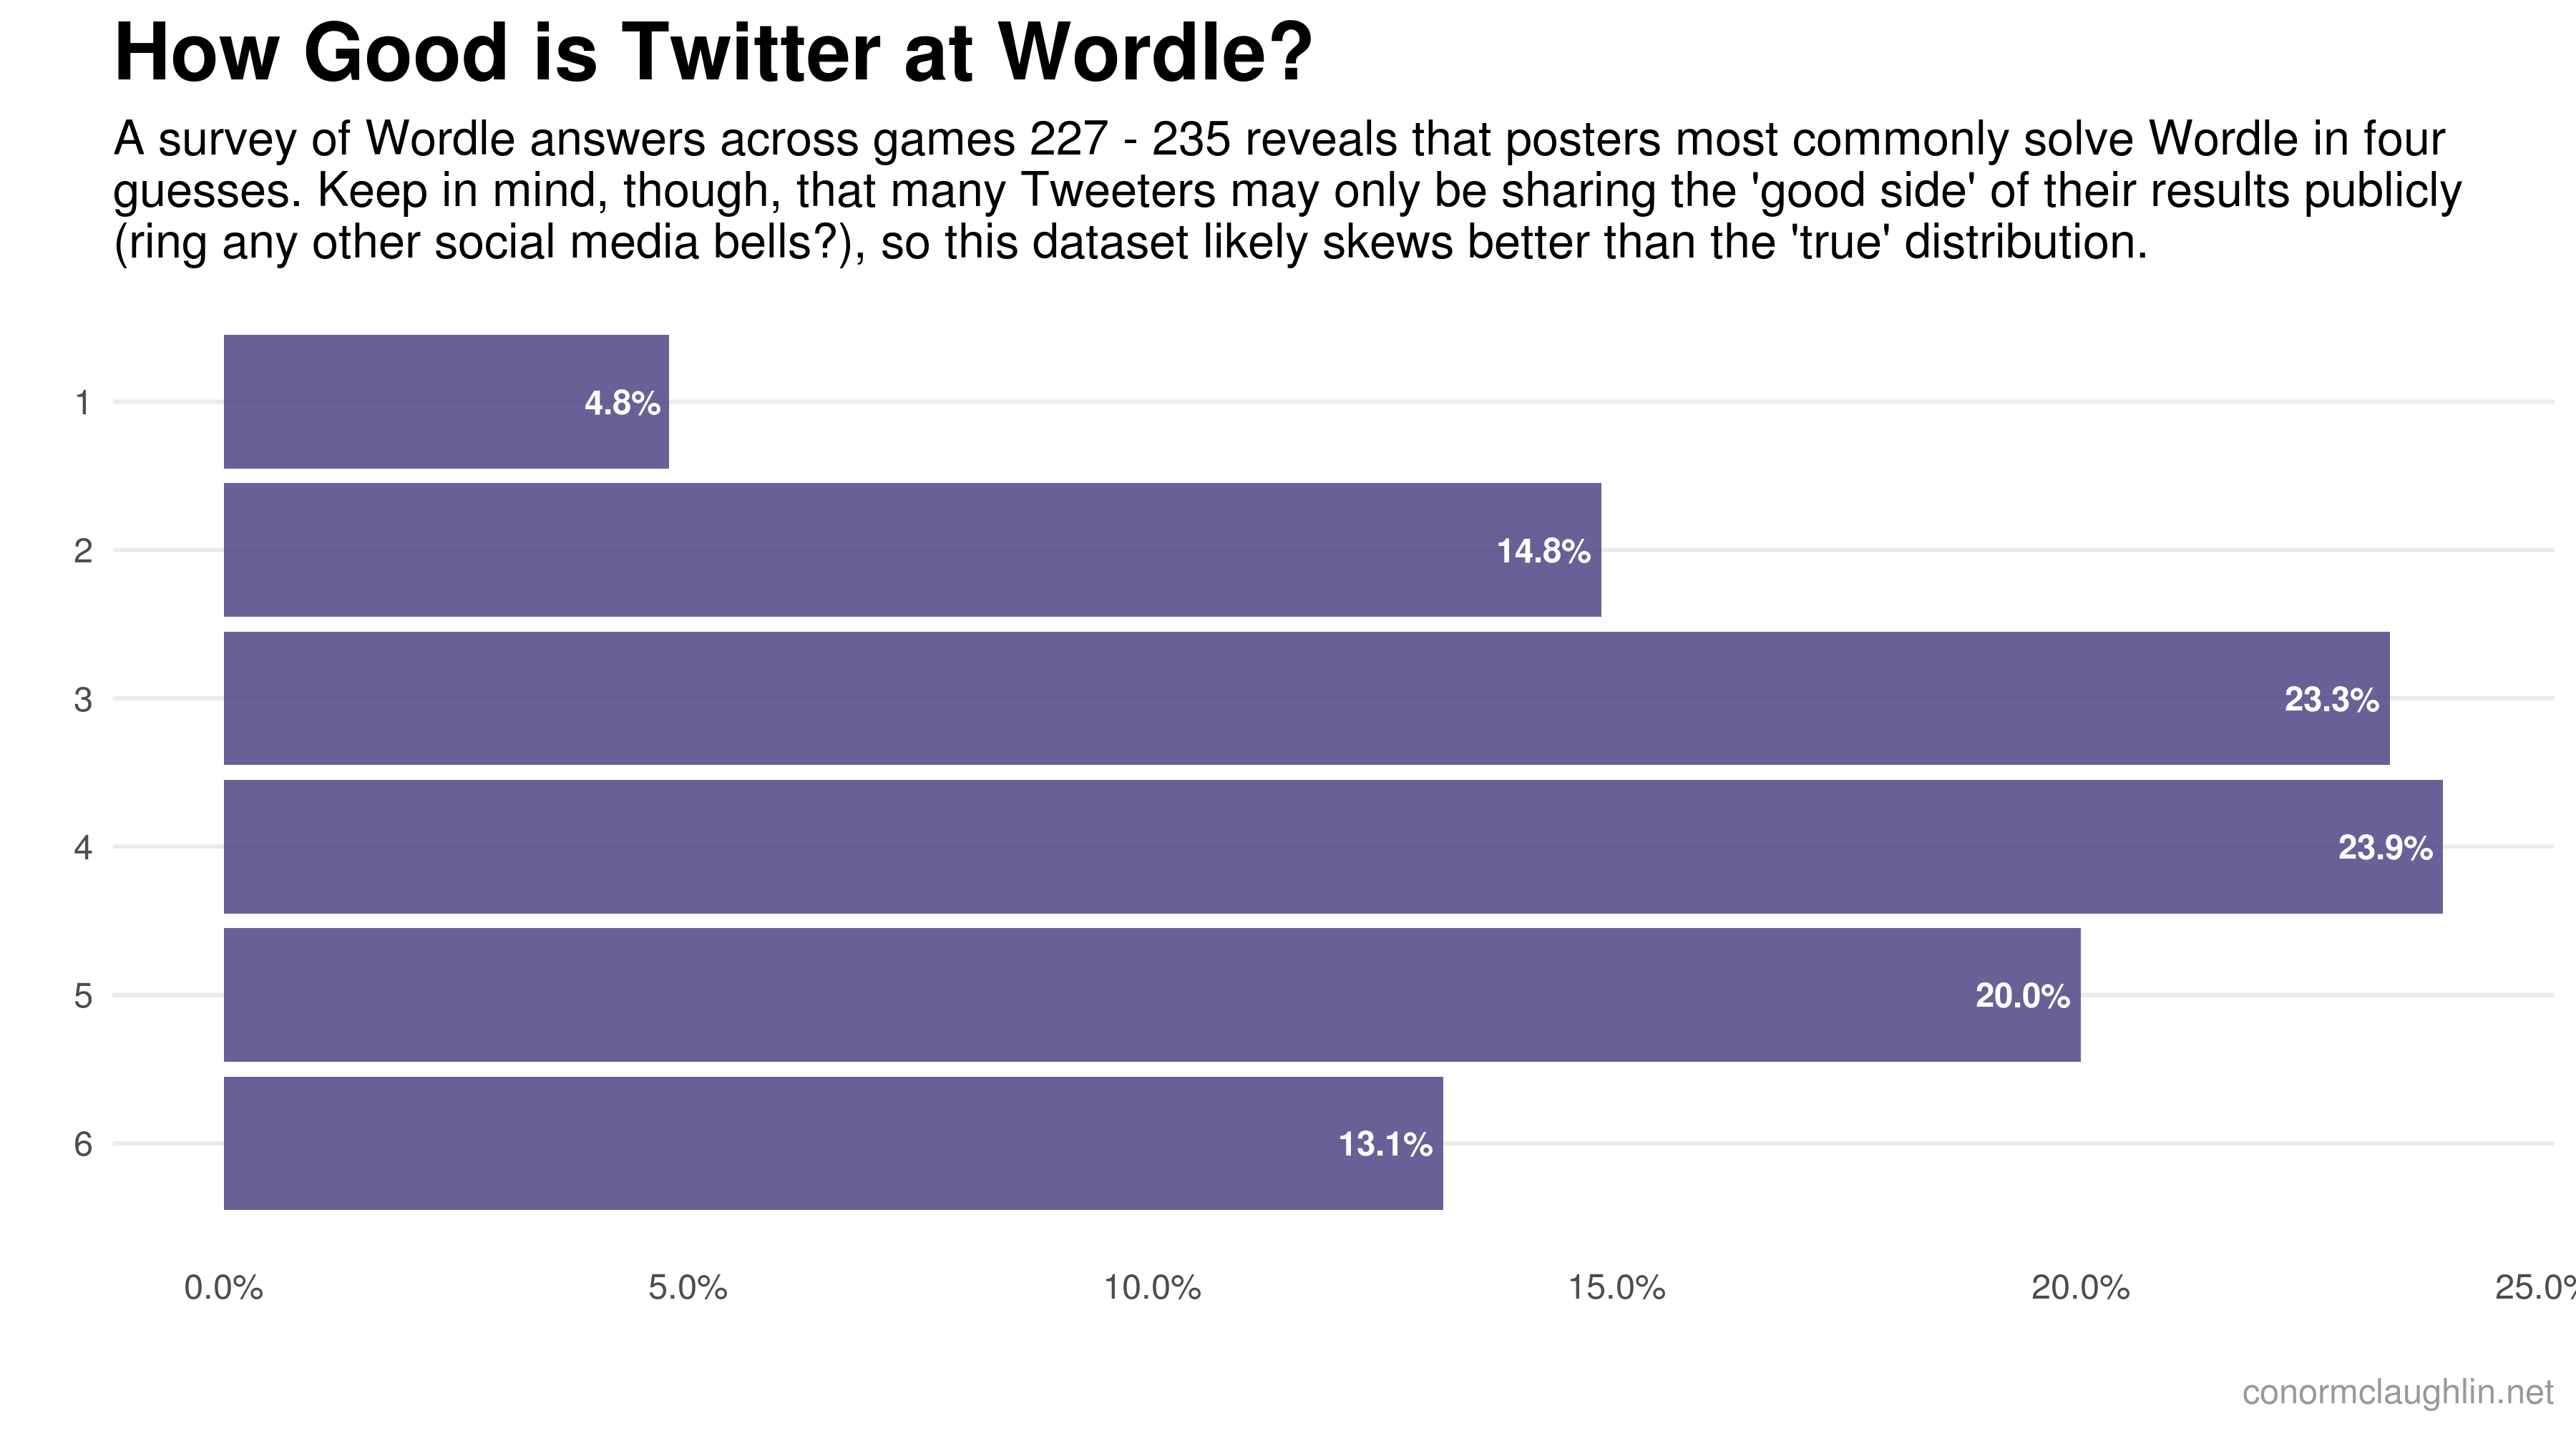
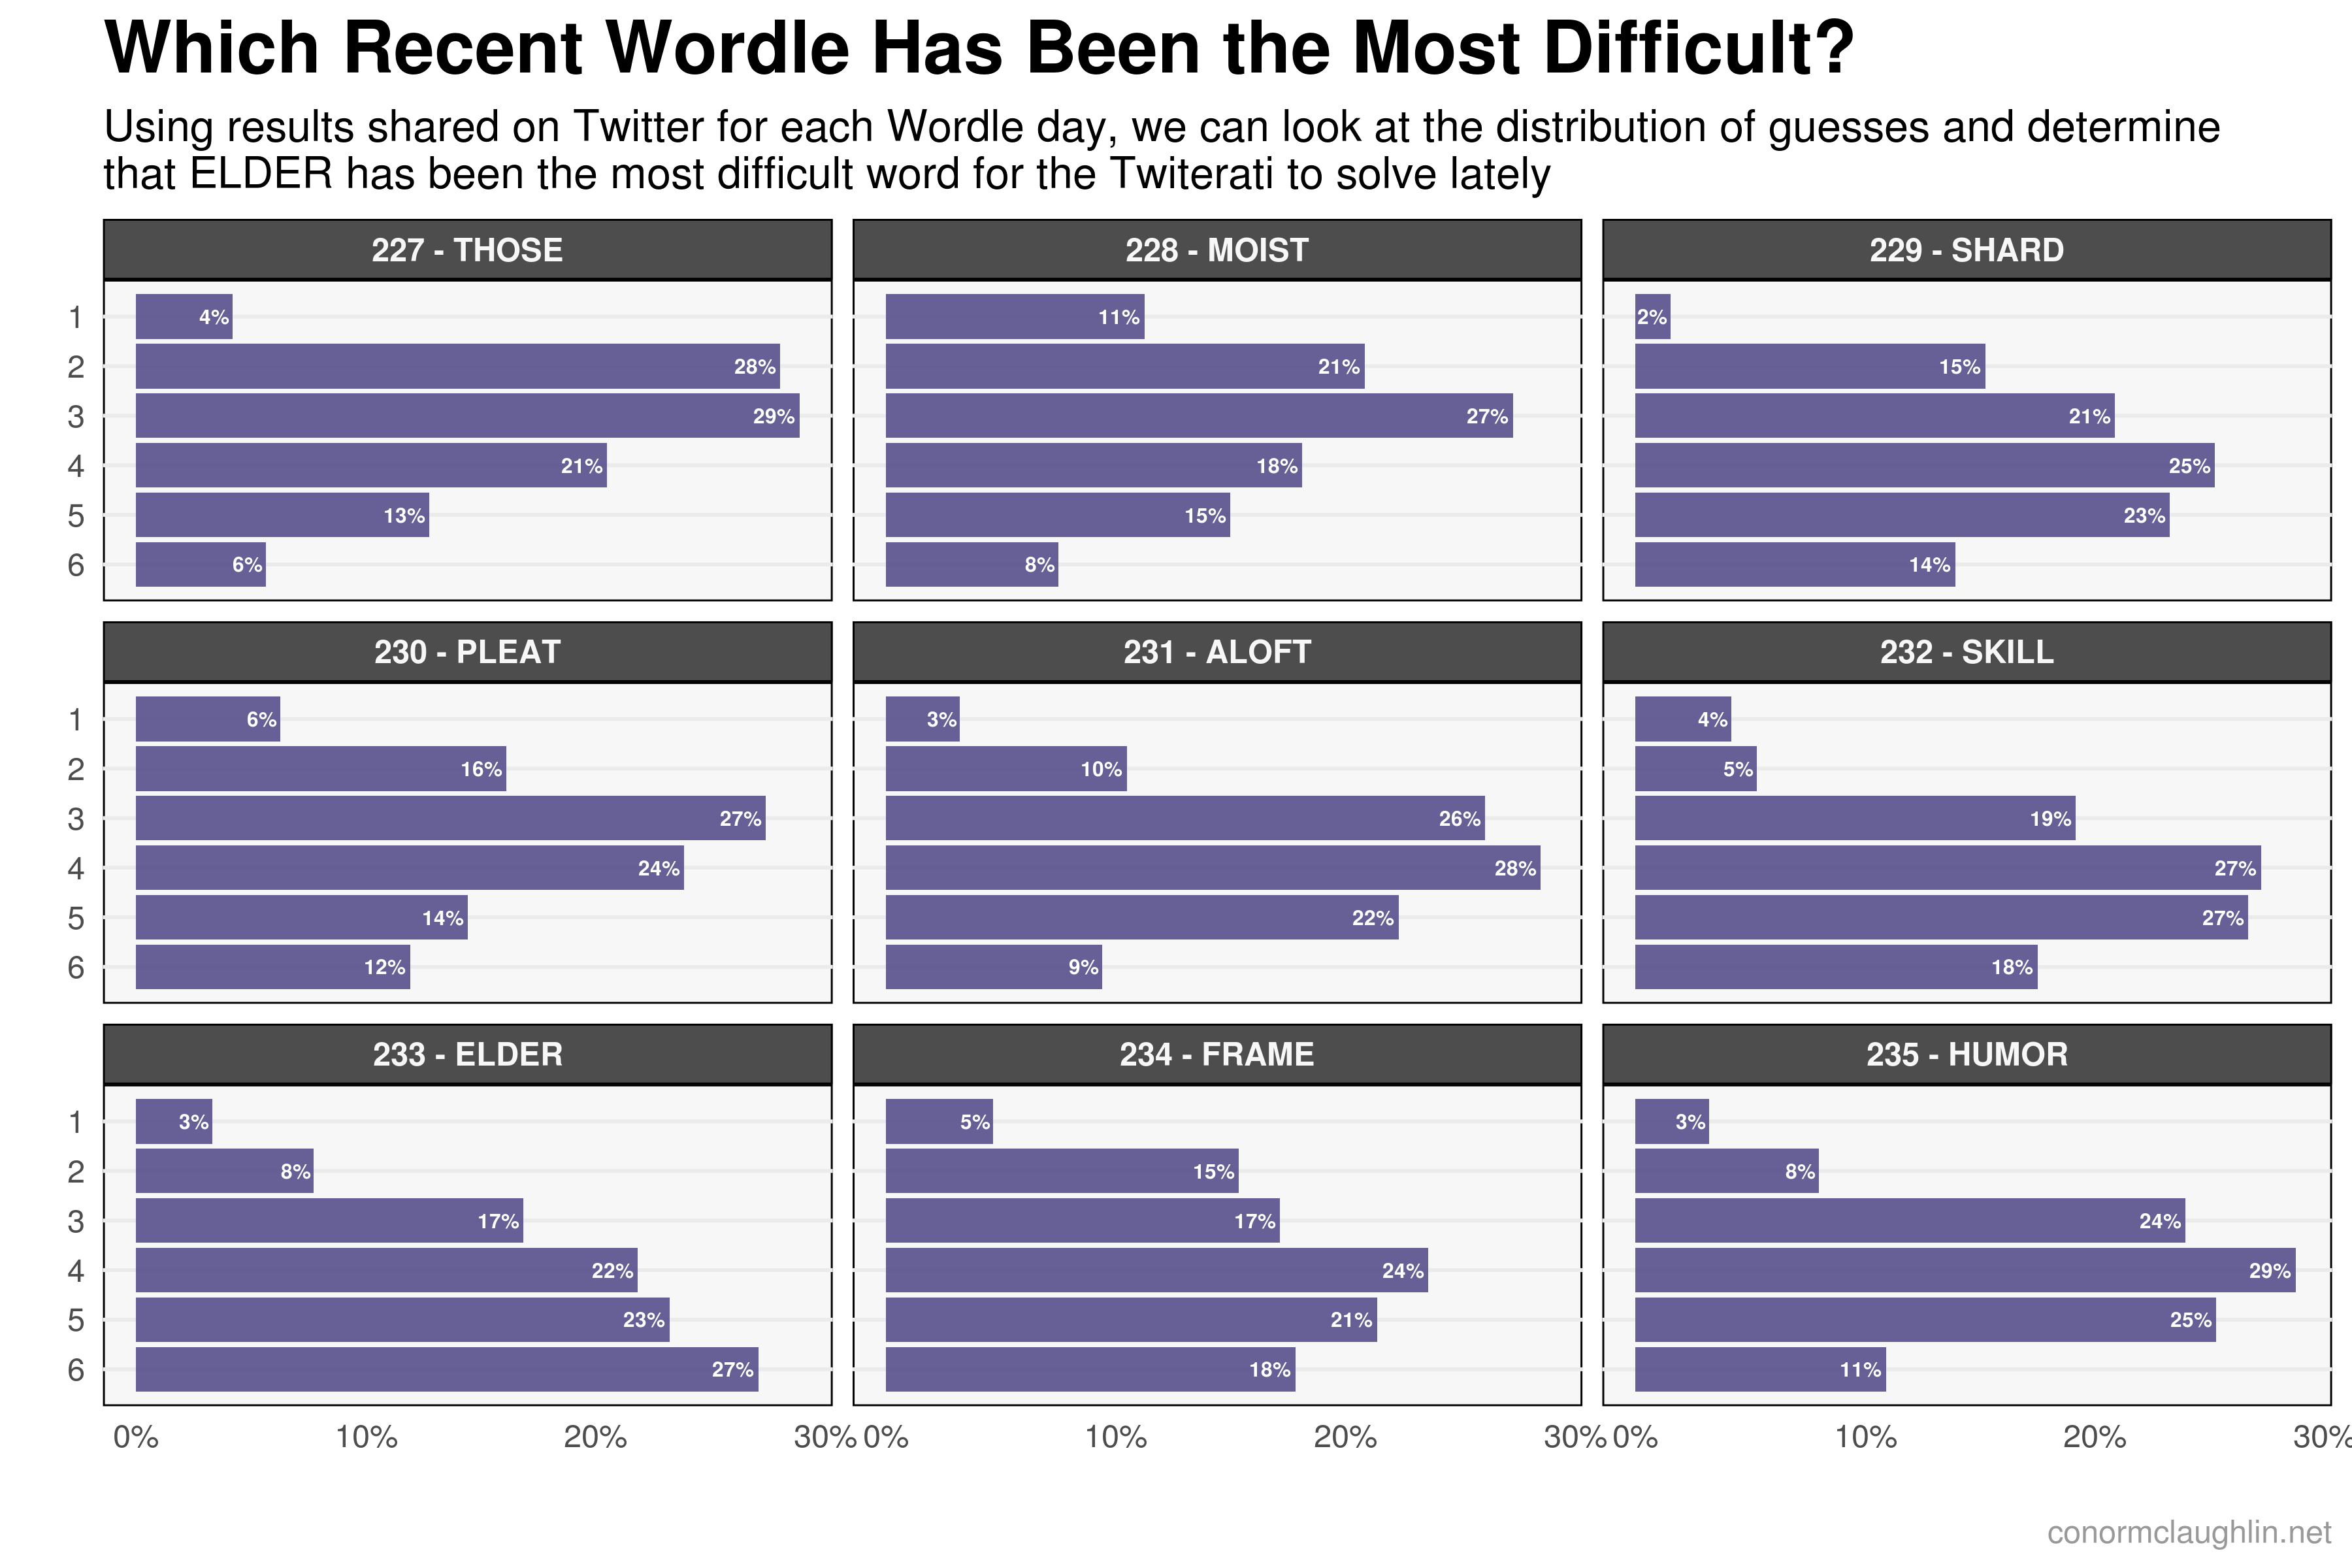
After looping through match days 227 through 235, I was able to amass about ~3,800 Tweets of well-formatted data, which ends up being about ~400 Tweets per day on average.
Visualizing Wordle Results
With a pretty-good sample of data successfully retrieved, the only thing left to do was to have fun visualizing the data! I started by plotting a single histogram of all responses in the same format that the Wordle app natively plots each user’s history. After feeling good about that, I then sought to break that view out by day, to show which words were the easiest and hardest for the internet to solve. Take a look below!