Ugh, Juan Soto. It almost broke my heart when the Nationals traded him last fall. Looking back on the deal, I’m happy with the package of prospects we got back from the Padres, with CJ Abrams and MacKenzie Gore as immediate starters with All-Star upside, and James Wood and Robert Hassell hopefully both future every-day contributors. But still - it’s terribly bittersweet to see my favorite player hitting for a different club.
And see him hit I most certainly did this past weekend! The Padres were in LA to play the Dodgers for a three games series, and I was able to catch the Friday evening and Sunday afternoon games, with Soto going 1-4 and 0-4, respectively.
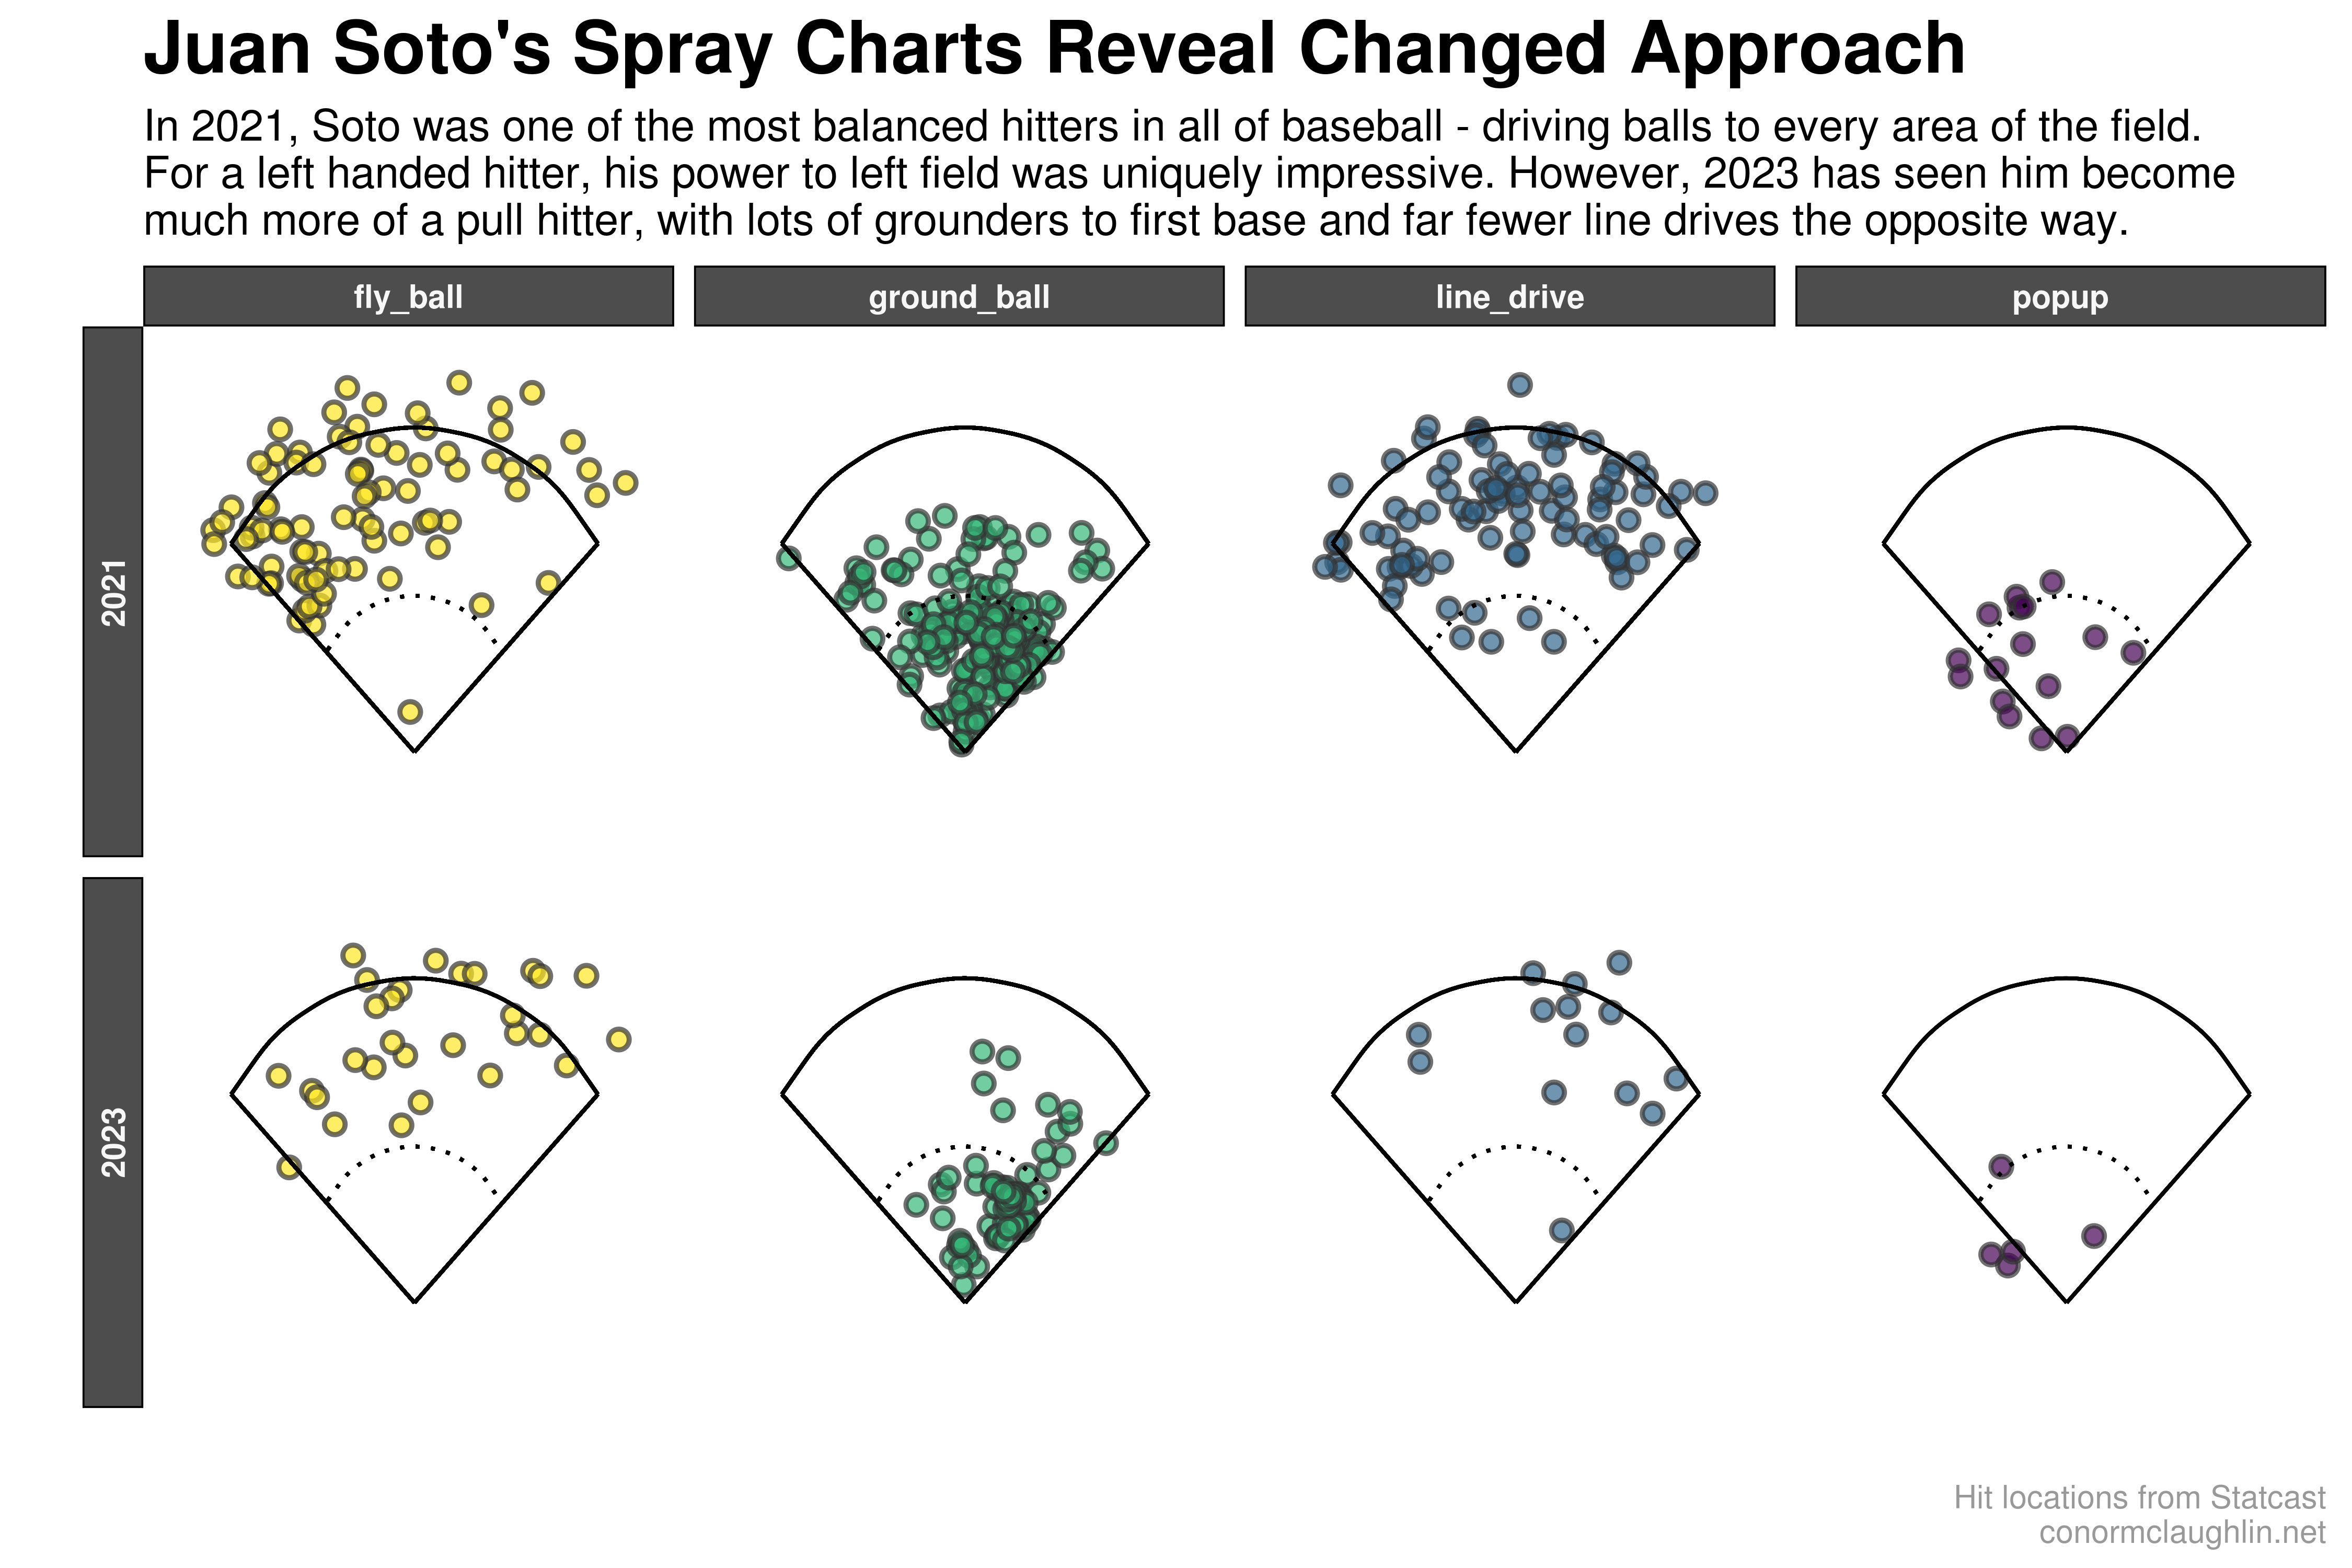
Juan Soto’s Rough Start to 2023
Unfortunately, that sort of stat line has been far too common for Juan - as of May 18th, he’s hitting .252 and slugging just .471 (albeit with his insane usual volume of walks keeping his OBP at a healthy .402).
Based on my experience as a Nationals fan, I have observed that Juan is at his best when he hits the ball in the opposite direction, but struggles when he rolls over balls towards the right side of the infield. Since I haven’t been able to watch as many of his games recently, I wanted to examine his hit distribution this season to determine if he has indeed fallen into this typical slump pattern.
Spray Charts by Batted Ball Type, 2021 vs 2023
To accomplish this, we’ll collect Juan’s batted ball locations from MLB Statcast and then build spray charts to visually display the locations where the hits are clustering. We’ll look to compare the current season against Juan’s 2021 season, where he went .313/.465./.999 and was the closest thing to Ted Williams I’ve ever seen - a benchmark of everything going right for his swing.
The data seems to confirm our hypothesis - Juan isn’t driving the ball to the opposite field with power thus far in 2023, and seems to be pulling the ball at a much higher rate than his all-world season in 2021.
Code to Build Visualizations
Huge shoutout to the baseballr developers for creating the statcast_search method to query raw MLB Statcast data and the ggspraychart layer to build ggplot2 compatible graphics!
Acquire Batted Ball Data from Statcast
library(baseballr)
library(tidyverse)

soto_2021 <- statcast_search(
  start_date = "2021-01-01",
  end_date = "2021-11-01",
  playerid = "665742",
  player_type = "batter"
) %>%
  filter(!is.na(hc_x)) %>%
  filter(game_type == "R")

soto_2023 <- statcast_search(
  start_date = "2023-01-01",
  end_date = "2023-11-01",
  playerid = "665742",
  player_type = "batter"
) %>%
  filter(!is.na(hc_x)) %>%
  filter(game_type == "R")

df <- rbind(soto_2021, soto_2023)
Build Faceted Spray Chart Visualization
library(viridis)

ggspraychart(
  data = df,
  x_value = "hc_x",
  y_value = "-hc_y",
  fill_value = "bb_type",
  fill_palette = viridis(4, option = "D", direction = -1),
  fill_legend_title = "Batted Ball Type",
  density = FALSE,
  bin_size = 15,
  point_alpha = 0.7,
  point_size = 2,
  frame = NULL
) +
  facet_grid(rows = vars(game_year), cols = vars(bb_type), switch = "y") +
  theme_minimal() +
  scale_color_manual("grey90") +
  theme(
    strip.background = element_rect(fill = "grey30"),
    strip.text = element_text(color = "grey97", face = "bold"),
    axis.text.y = element_blank(),
    axis.text.x = element_blank(),
    legend.background = element_rect(color = NA),
    legend.position = "none",
    panel.grid = element_blank(),
    plot.title = element_text(size = 20, face = "bold"),
    plot.subtitle = element_text(size = 12),
    plot.caption = element_text(colour = "grey60")
  ) +
  labs(
    x = "",
    y = "",
    title =  "Juan Soto's Spray Charts Reveal Changed Approach",
    subtitle = "In 2021, Soto was one of the most balanced hitters in all of baseball - driving balls to every area of the field.\nFor a left handed hitter, his power to left field was uniquely impressive. However, 2023 has seen him become\nmuch more of a pull hitter, with lots of grounders to first base and far fewer line drives the opposite way.",
    caption = "Hit locations from Statcast\nconormclaughlin.net"
  )