This morning, the NFL Players Association (NFLPA) released their latest set of Team Report cards, following last year’s inaugural data. These report cards include grades by 1,706 players, scoring their own teams on a variety of player experience dimensions from A+ to F-.
This year, we saw Head Coach and Owner grades added on top of the eight areas from last year:
- Treatment of Families
- Food/Cafeteria
- Nutritionist/Dietician
- Locker Room
- Training Room
- Training Staff
- Weight Room
- Strength Coaches
- Team Travel
When this data came out last year, I found the presentation a bit lacking - the NFLPA just dumped the data into an ugly, unwieldy table! As such, I found it an easy and valuable exercise to build two sets of artifacts to better communicate the report cards: first, a league-wide heatmap of grades, and second, division-by-division circumplex charts. Feel free to take a peek at that post to see the data and how I put those charts together.
That grunt work left me in perfect position this morning when I saw the new season of data had dropped - I was able to easily re-run my visualization code to generate charts for 2023-2024. Of course, this now includes the Head Coach and Owner scores, which are interesting to say the least - take a peek below!
League-Wide Report Cards

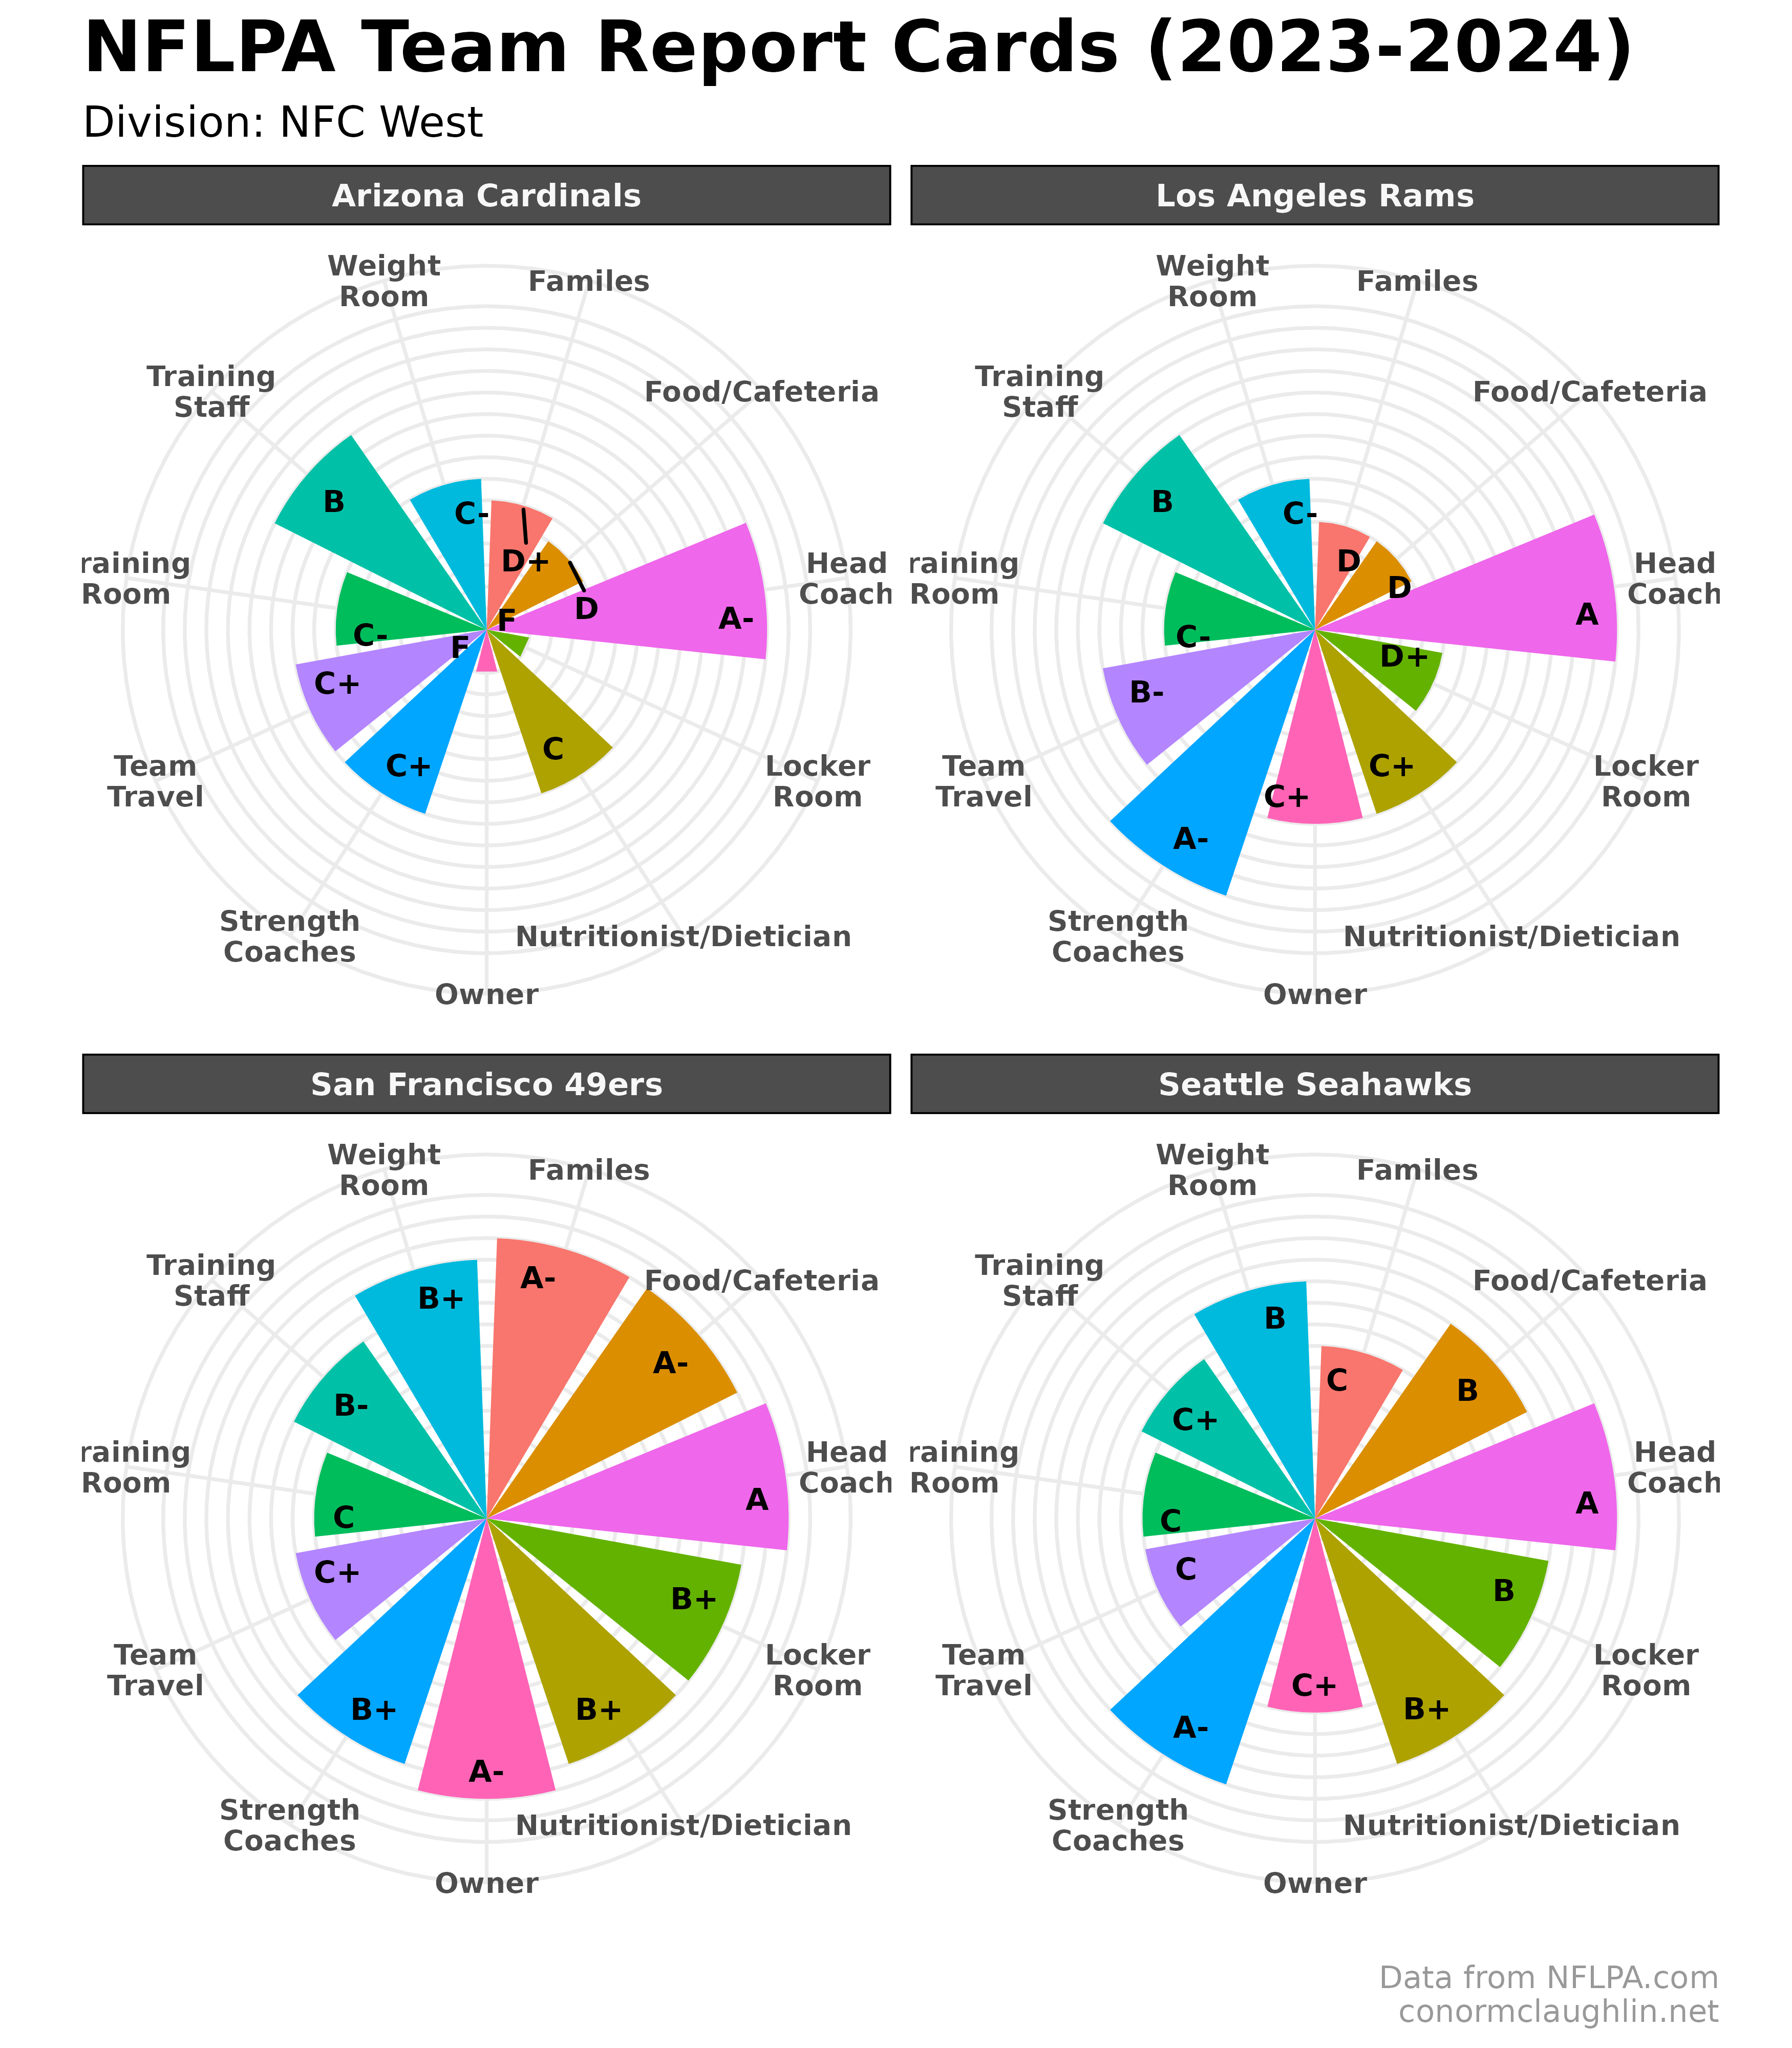
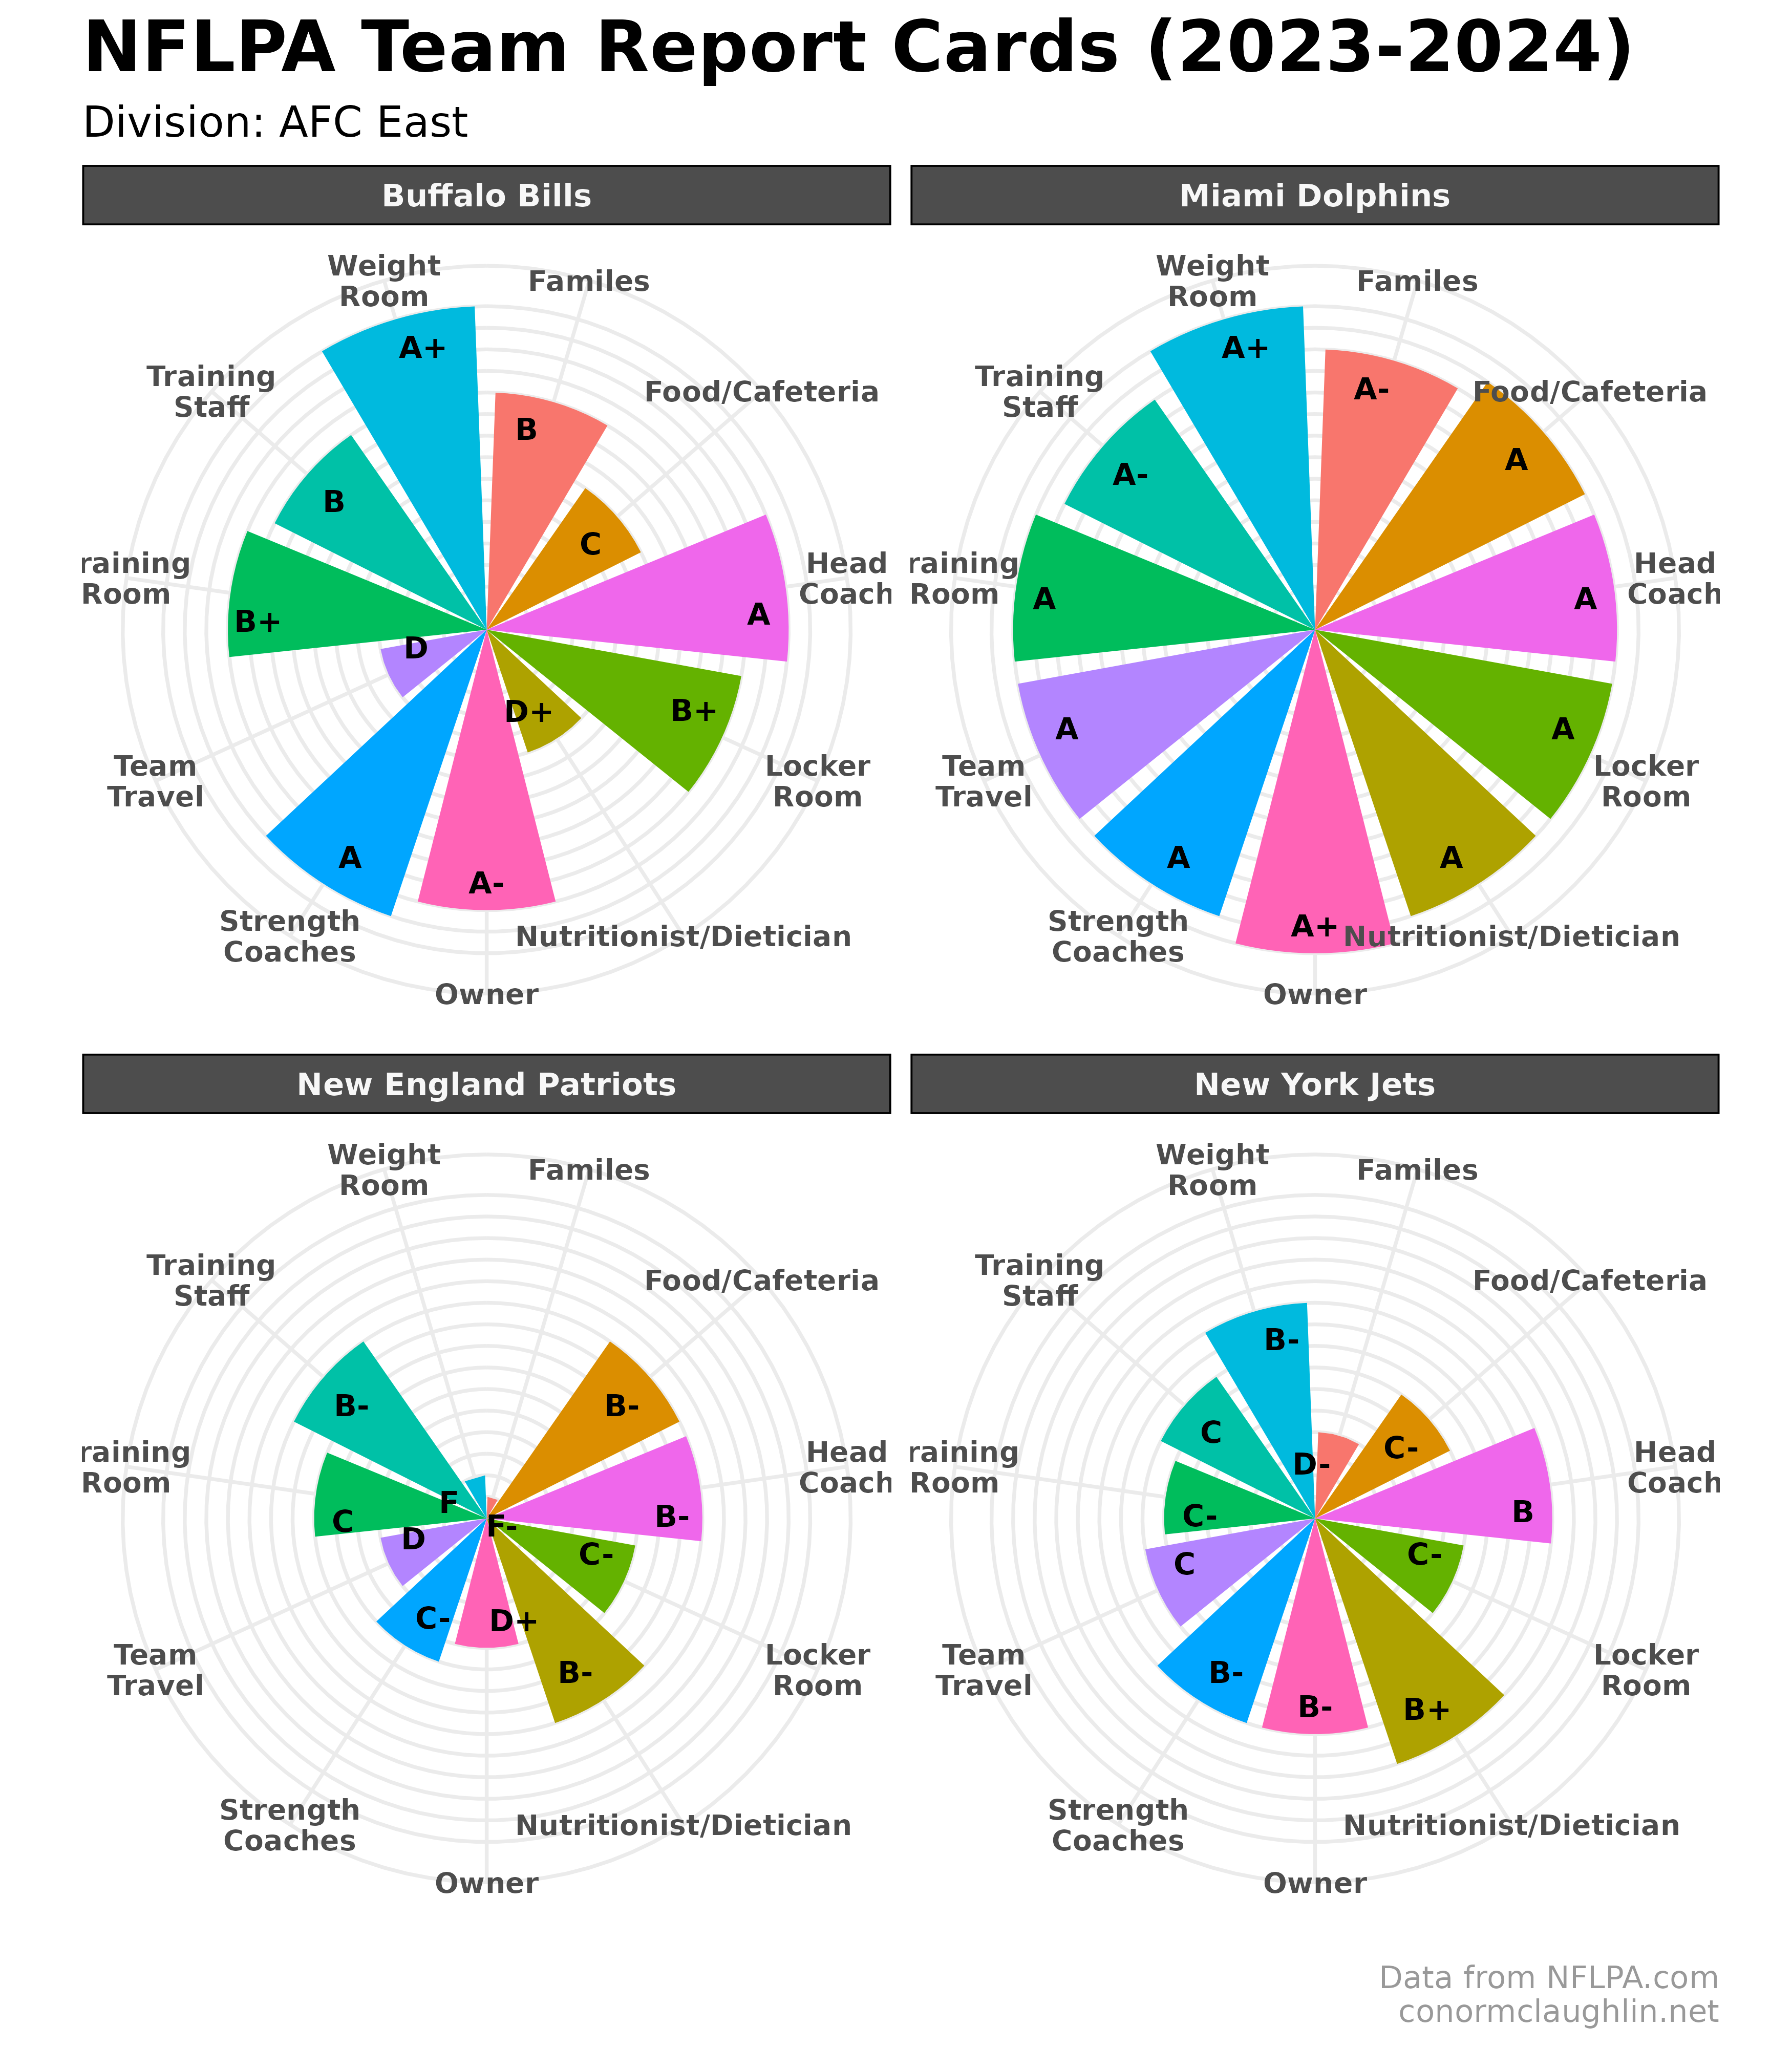
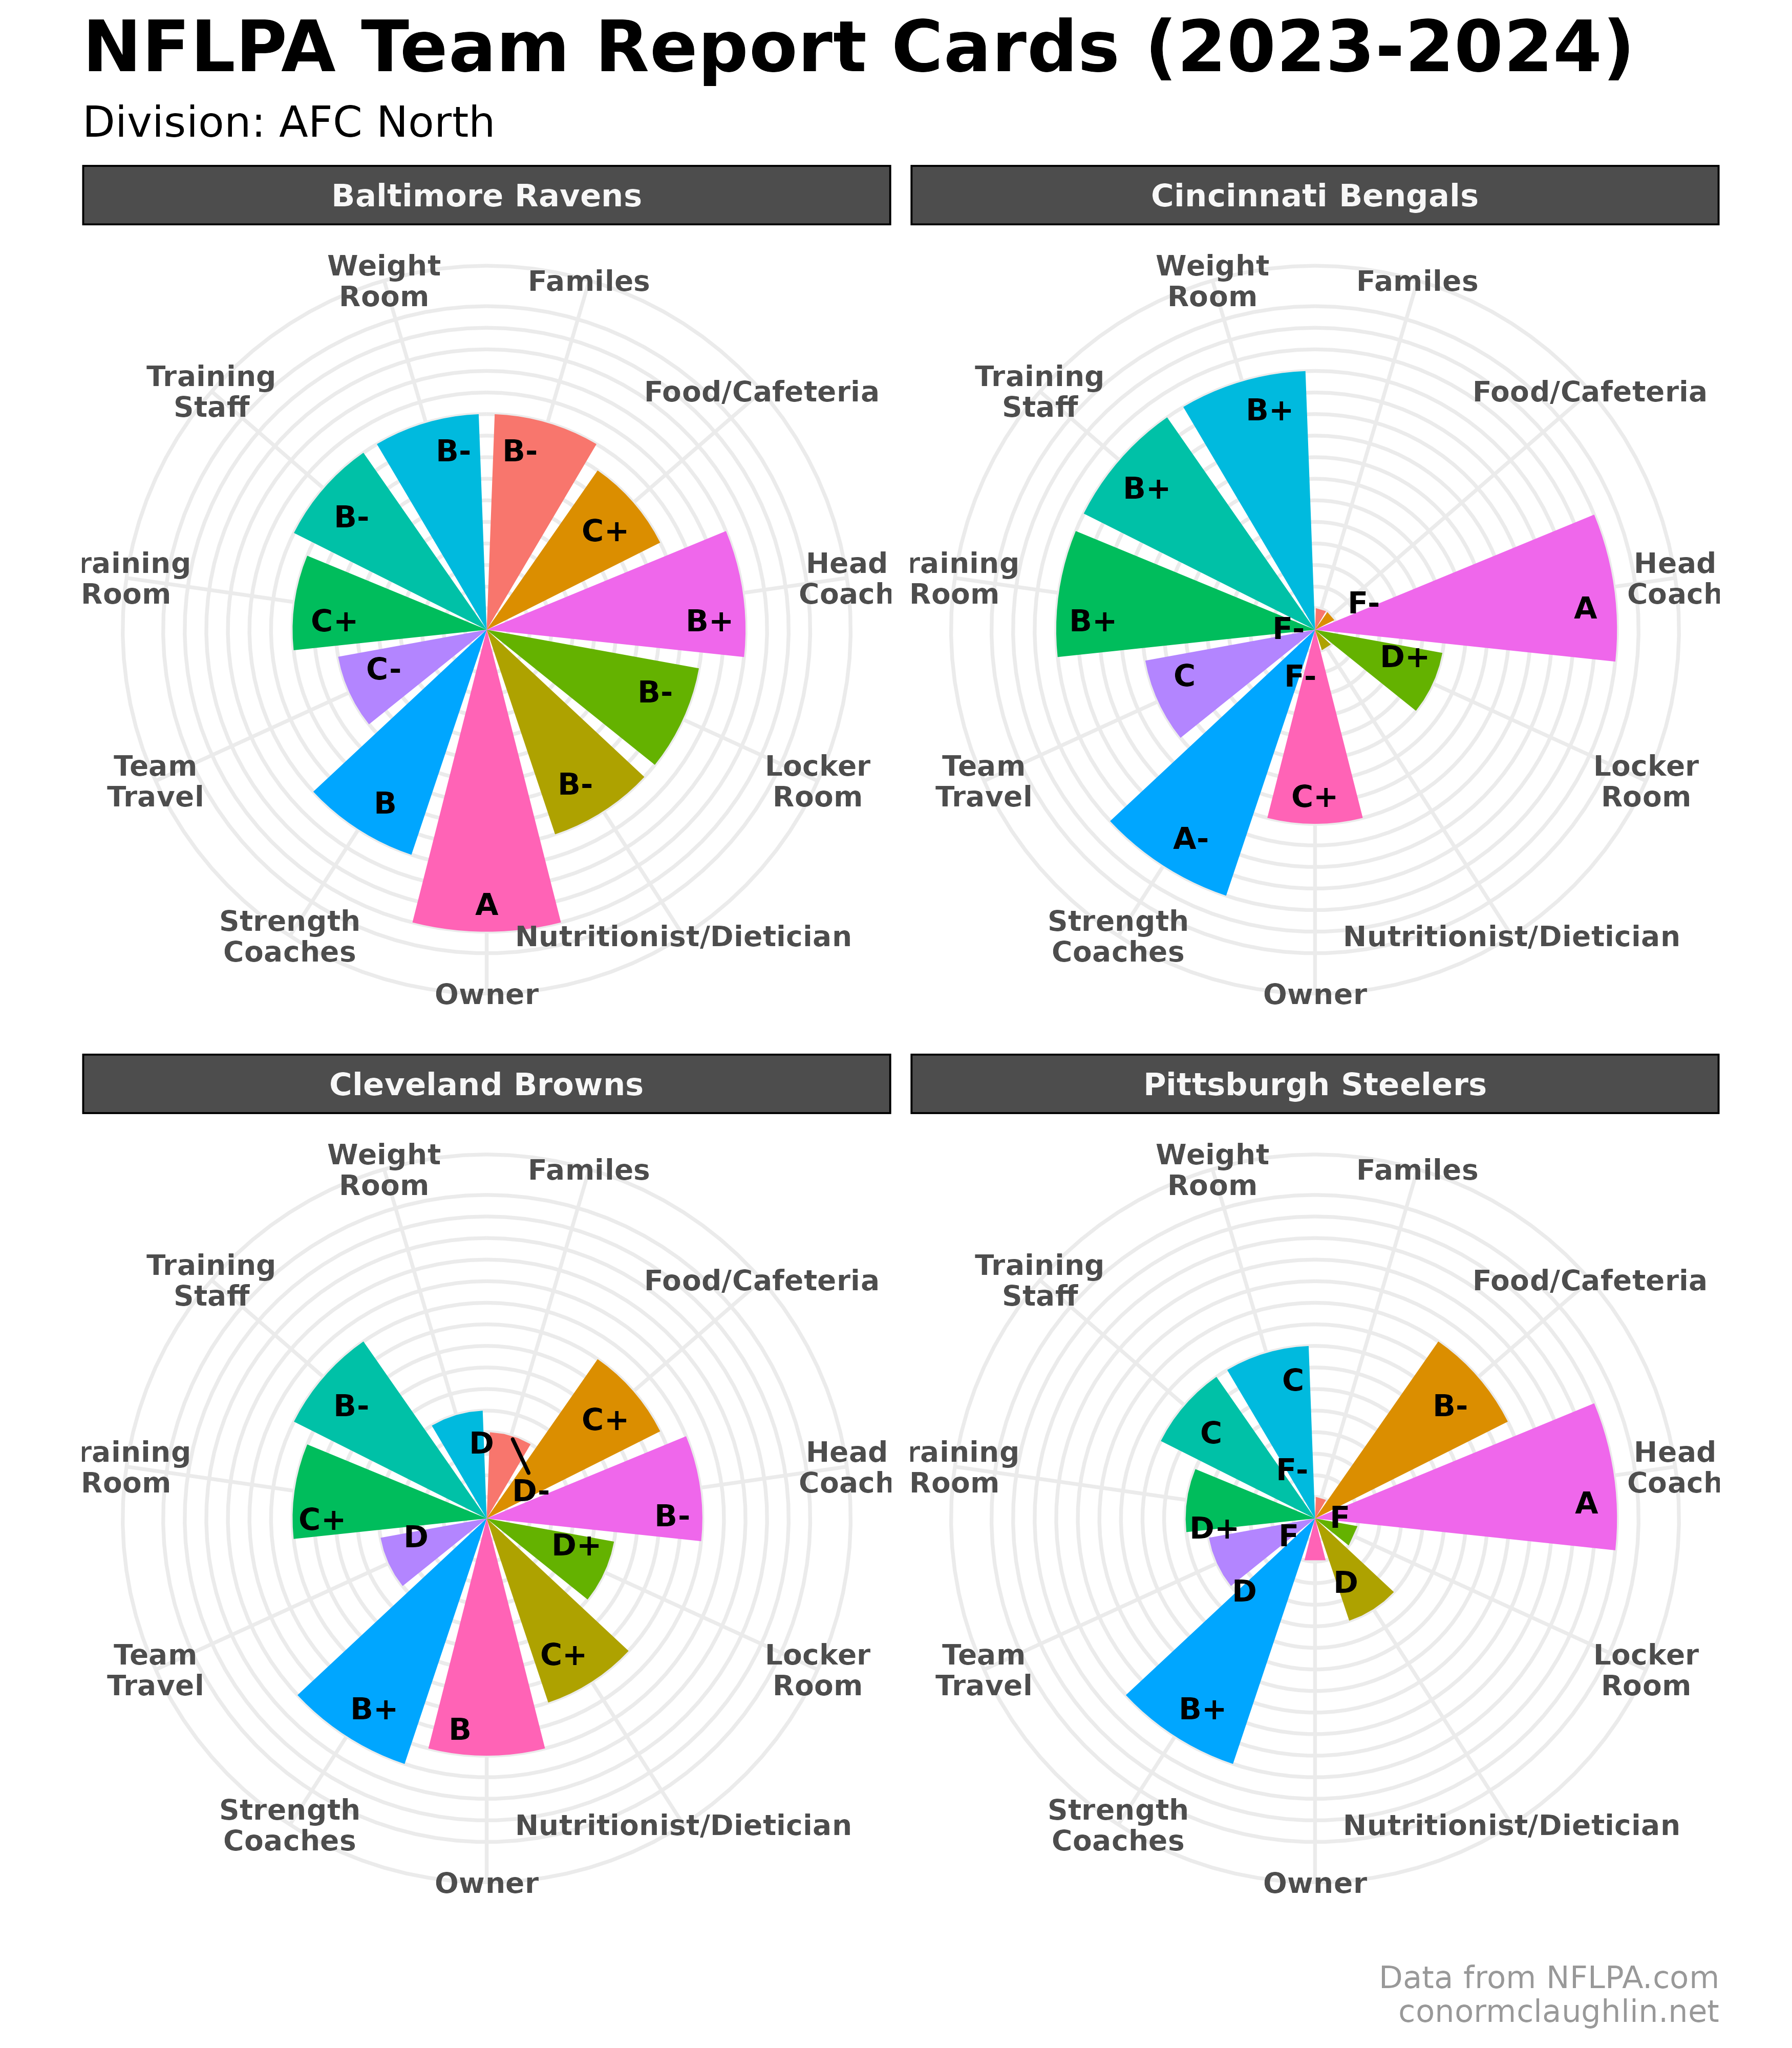
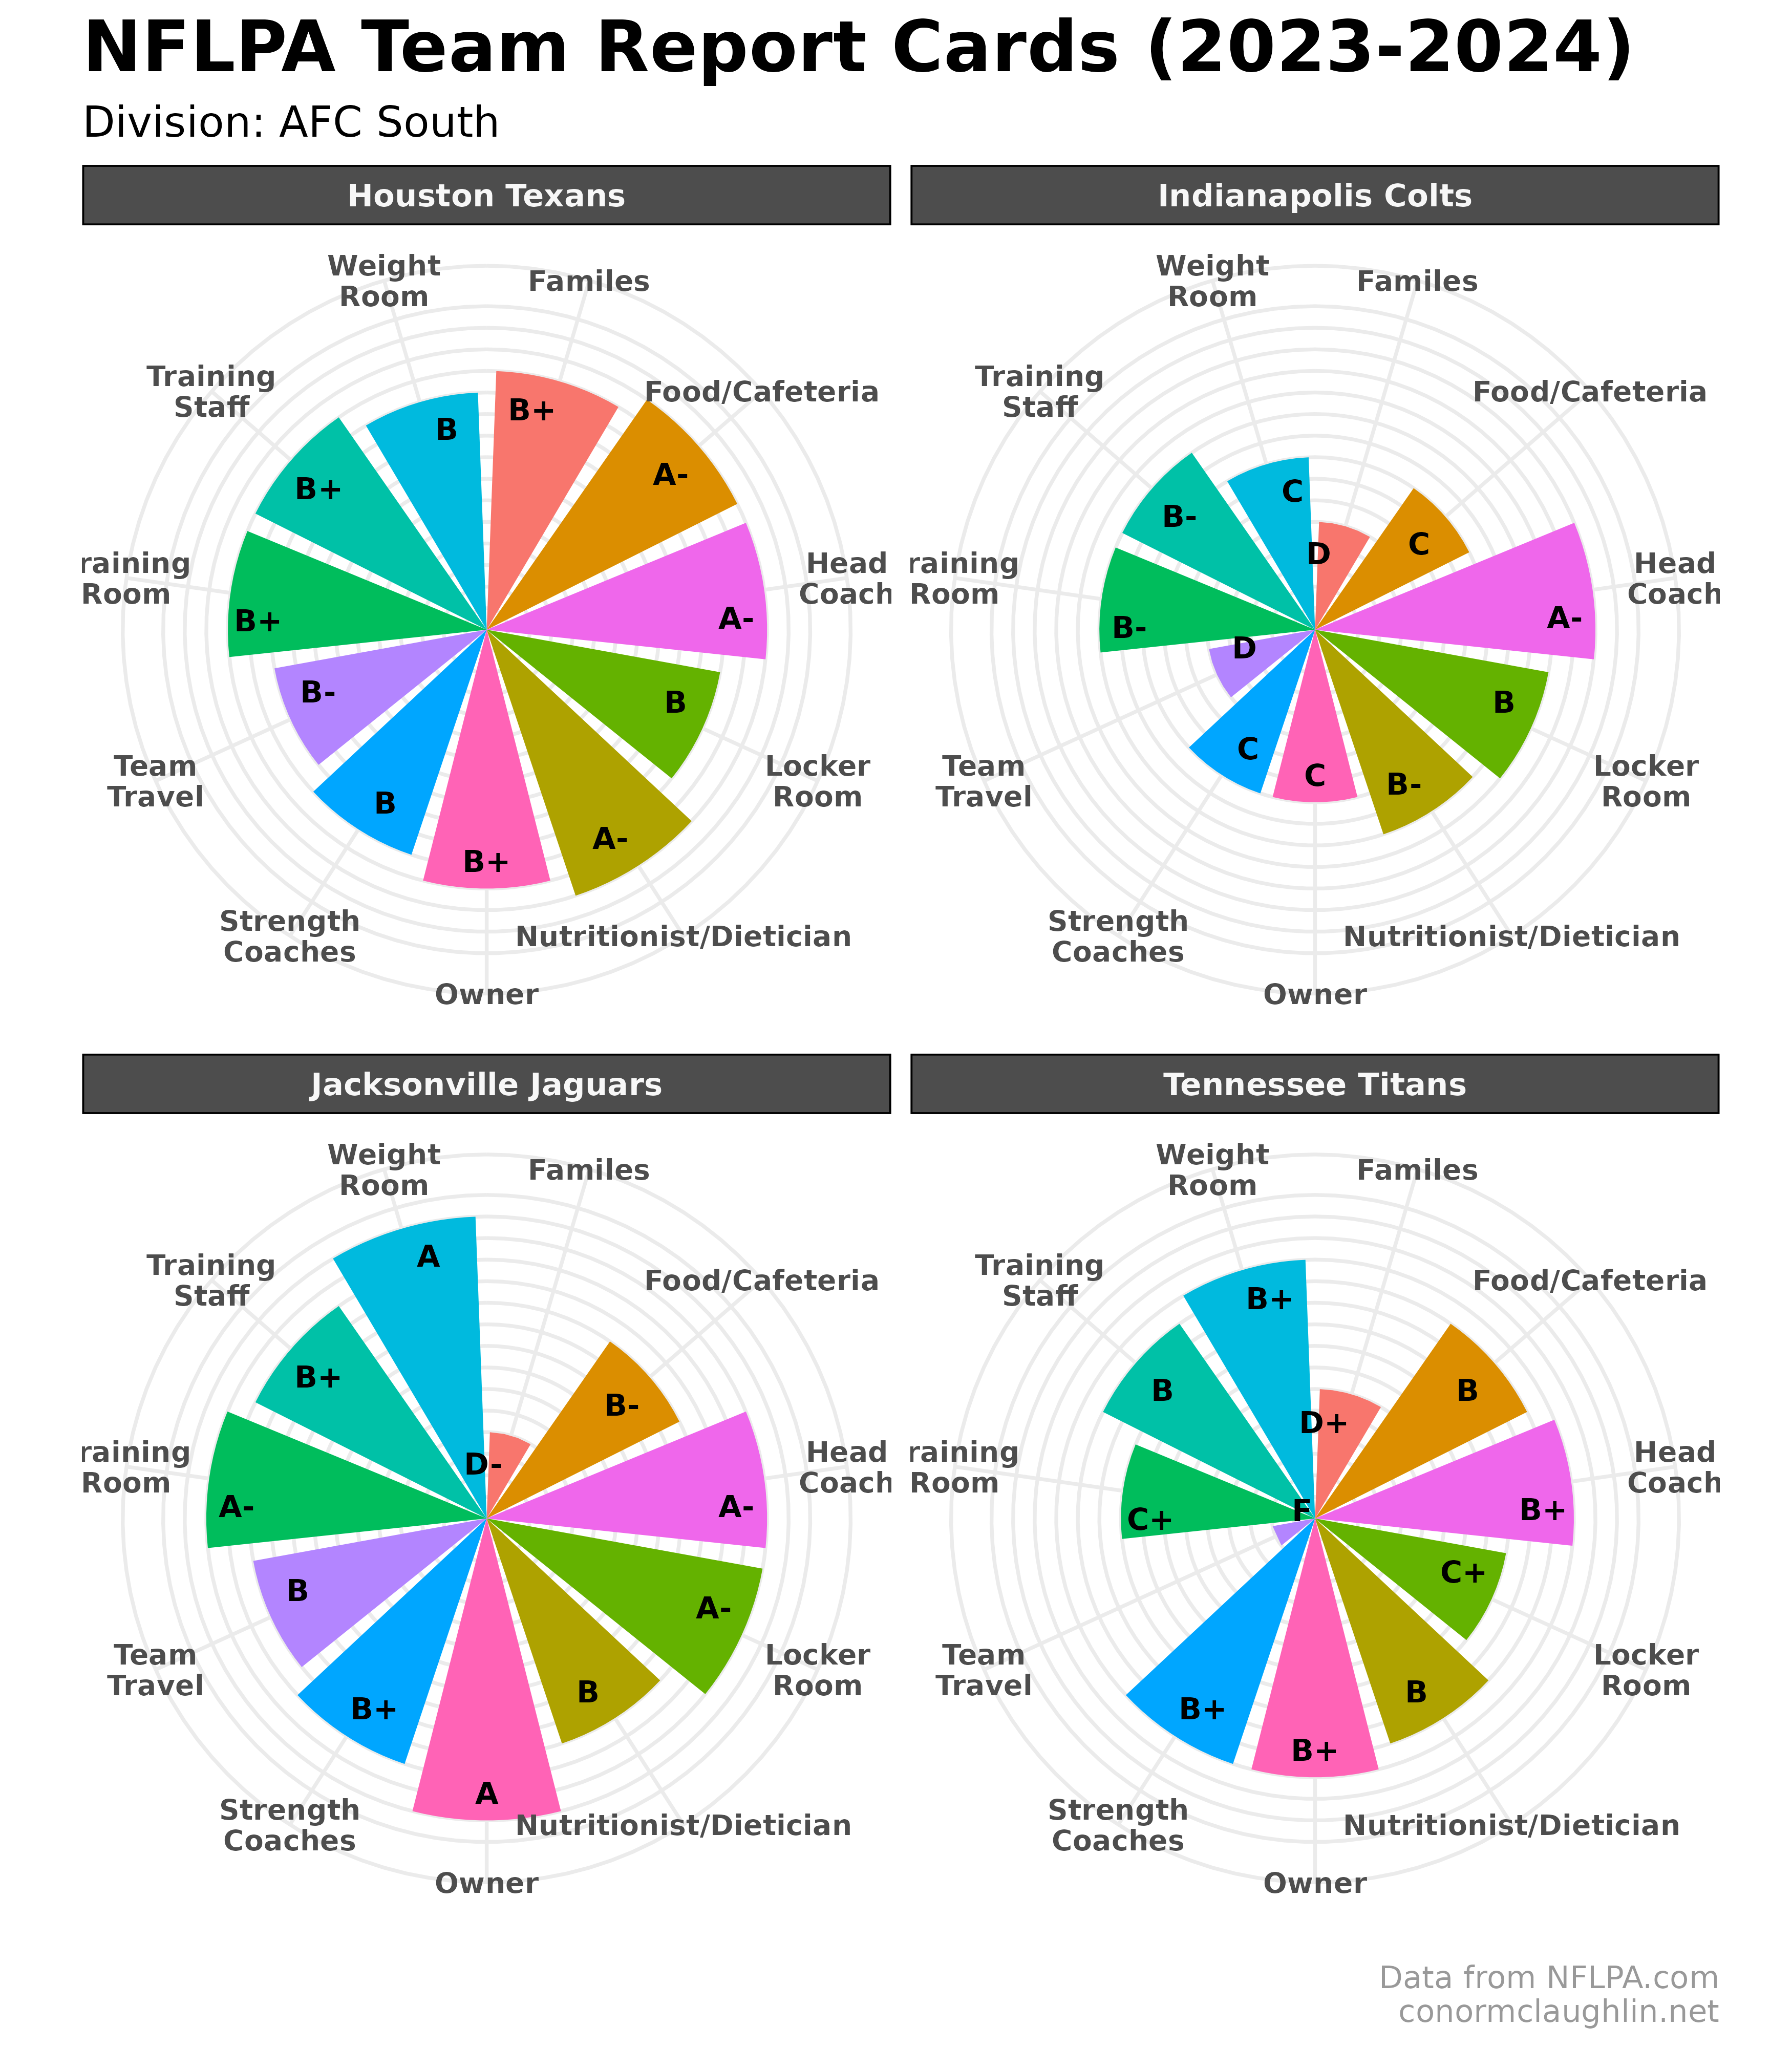
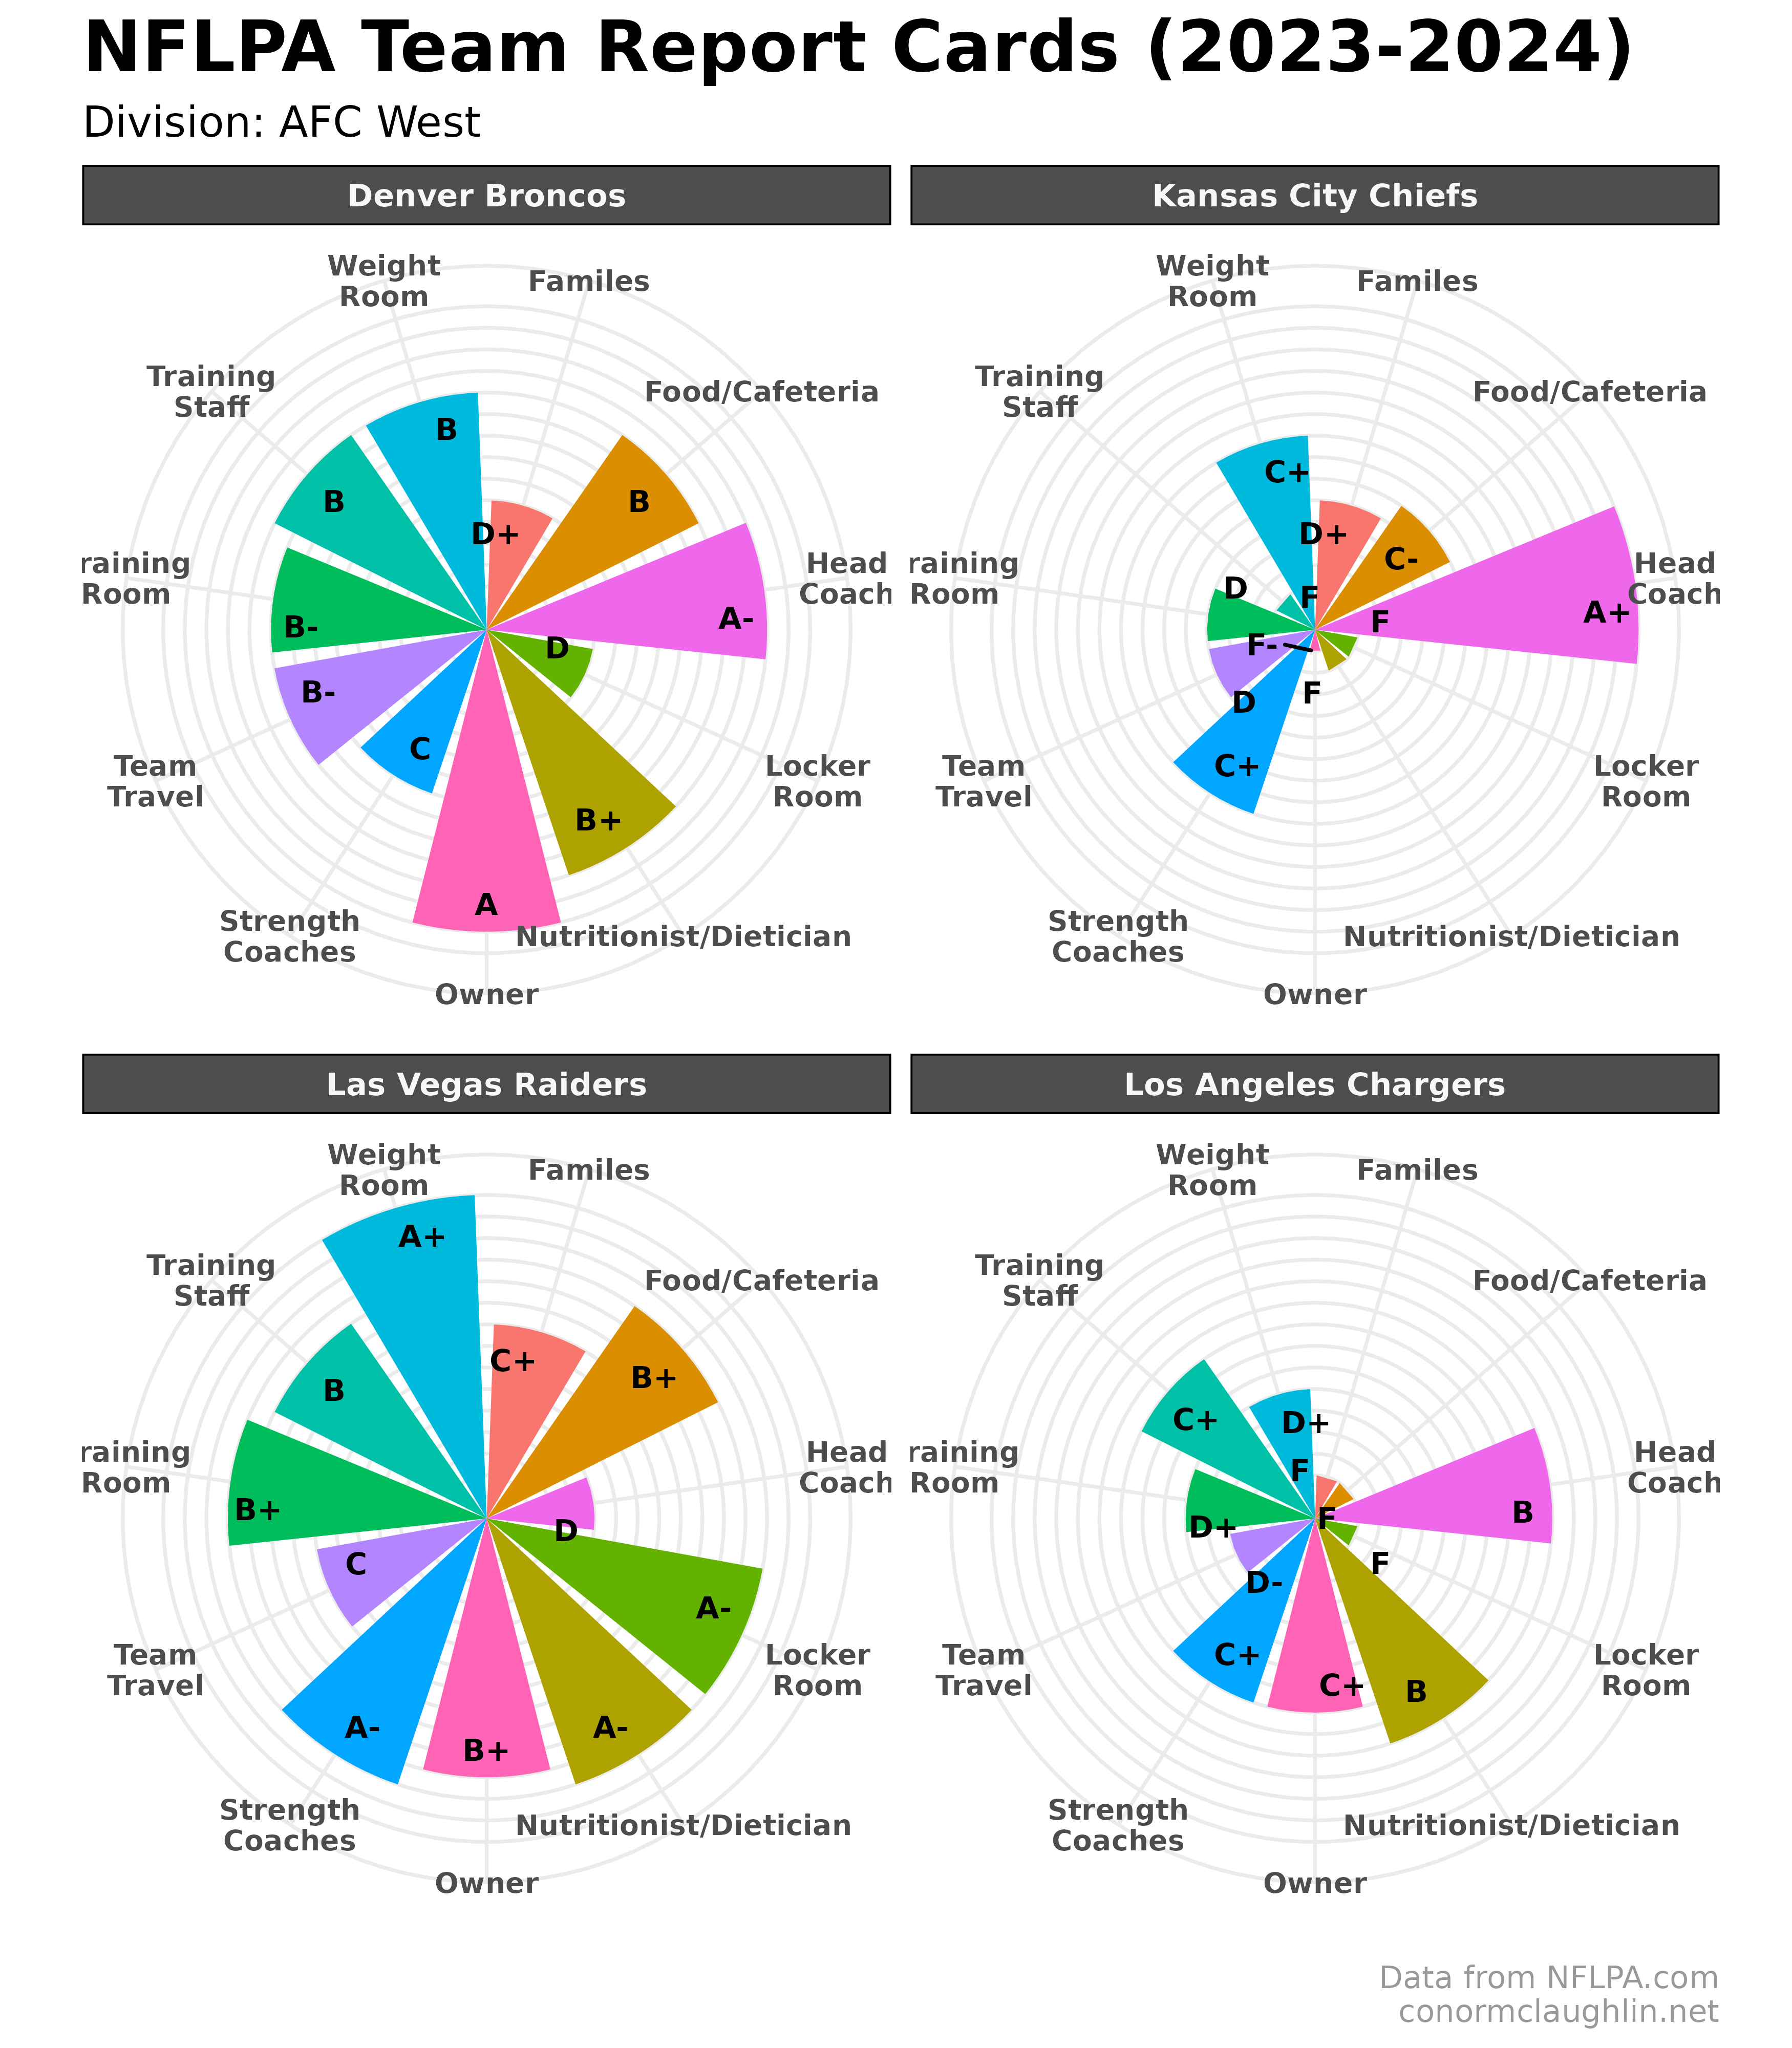
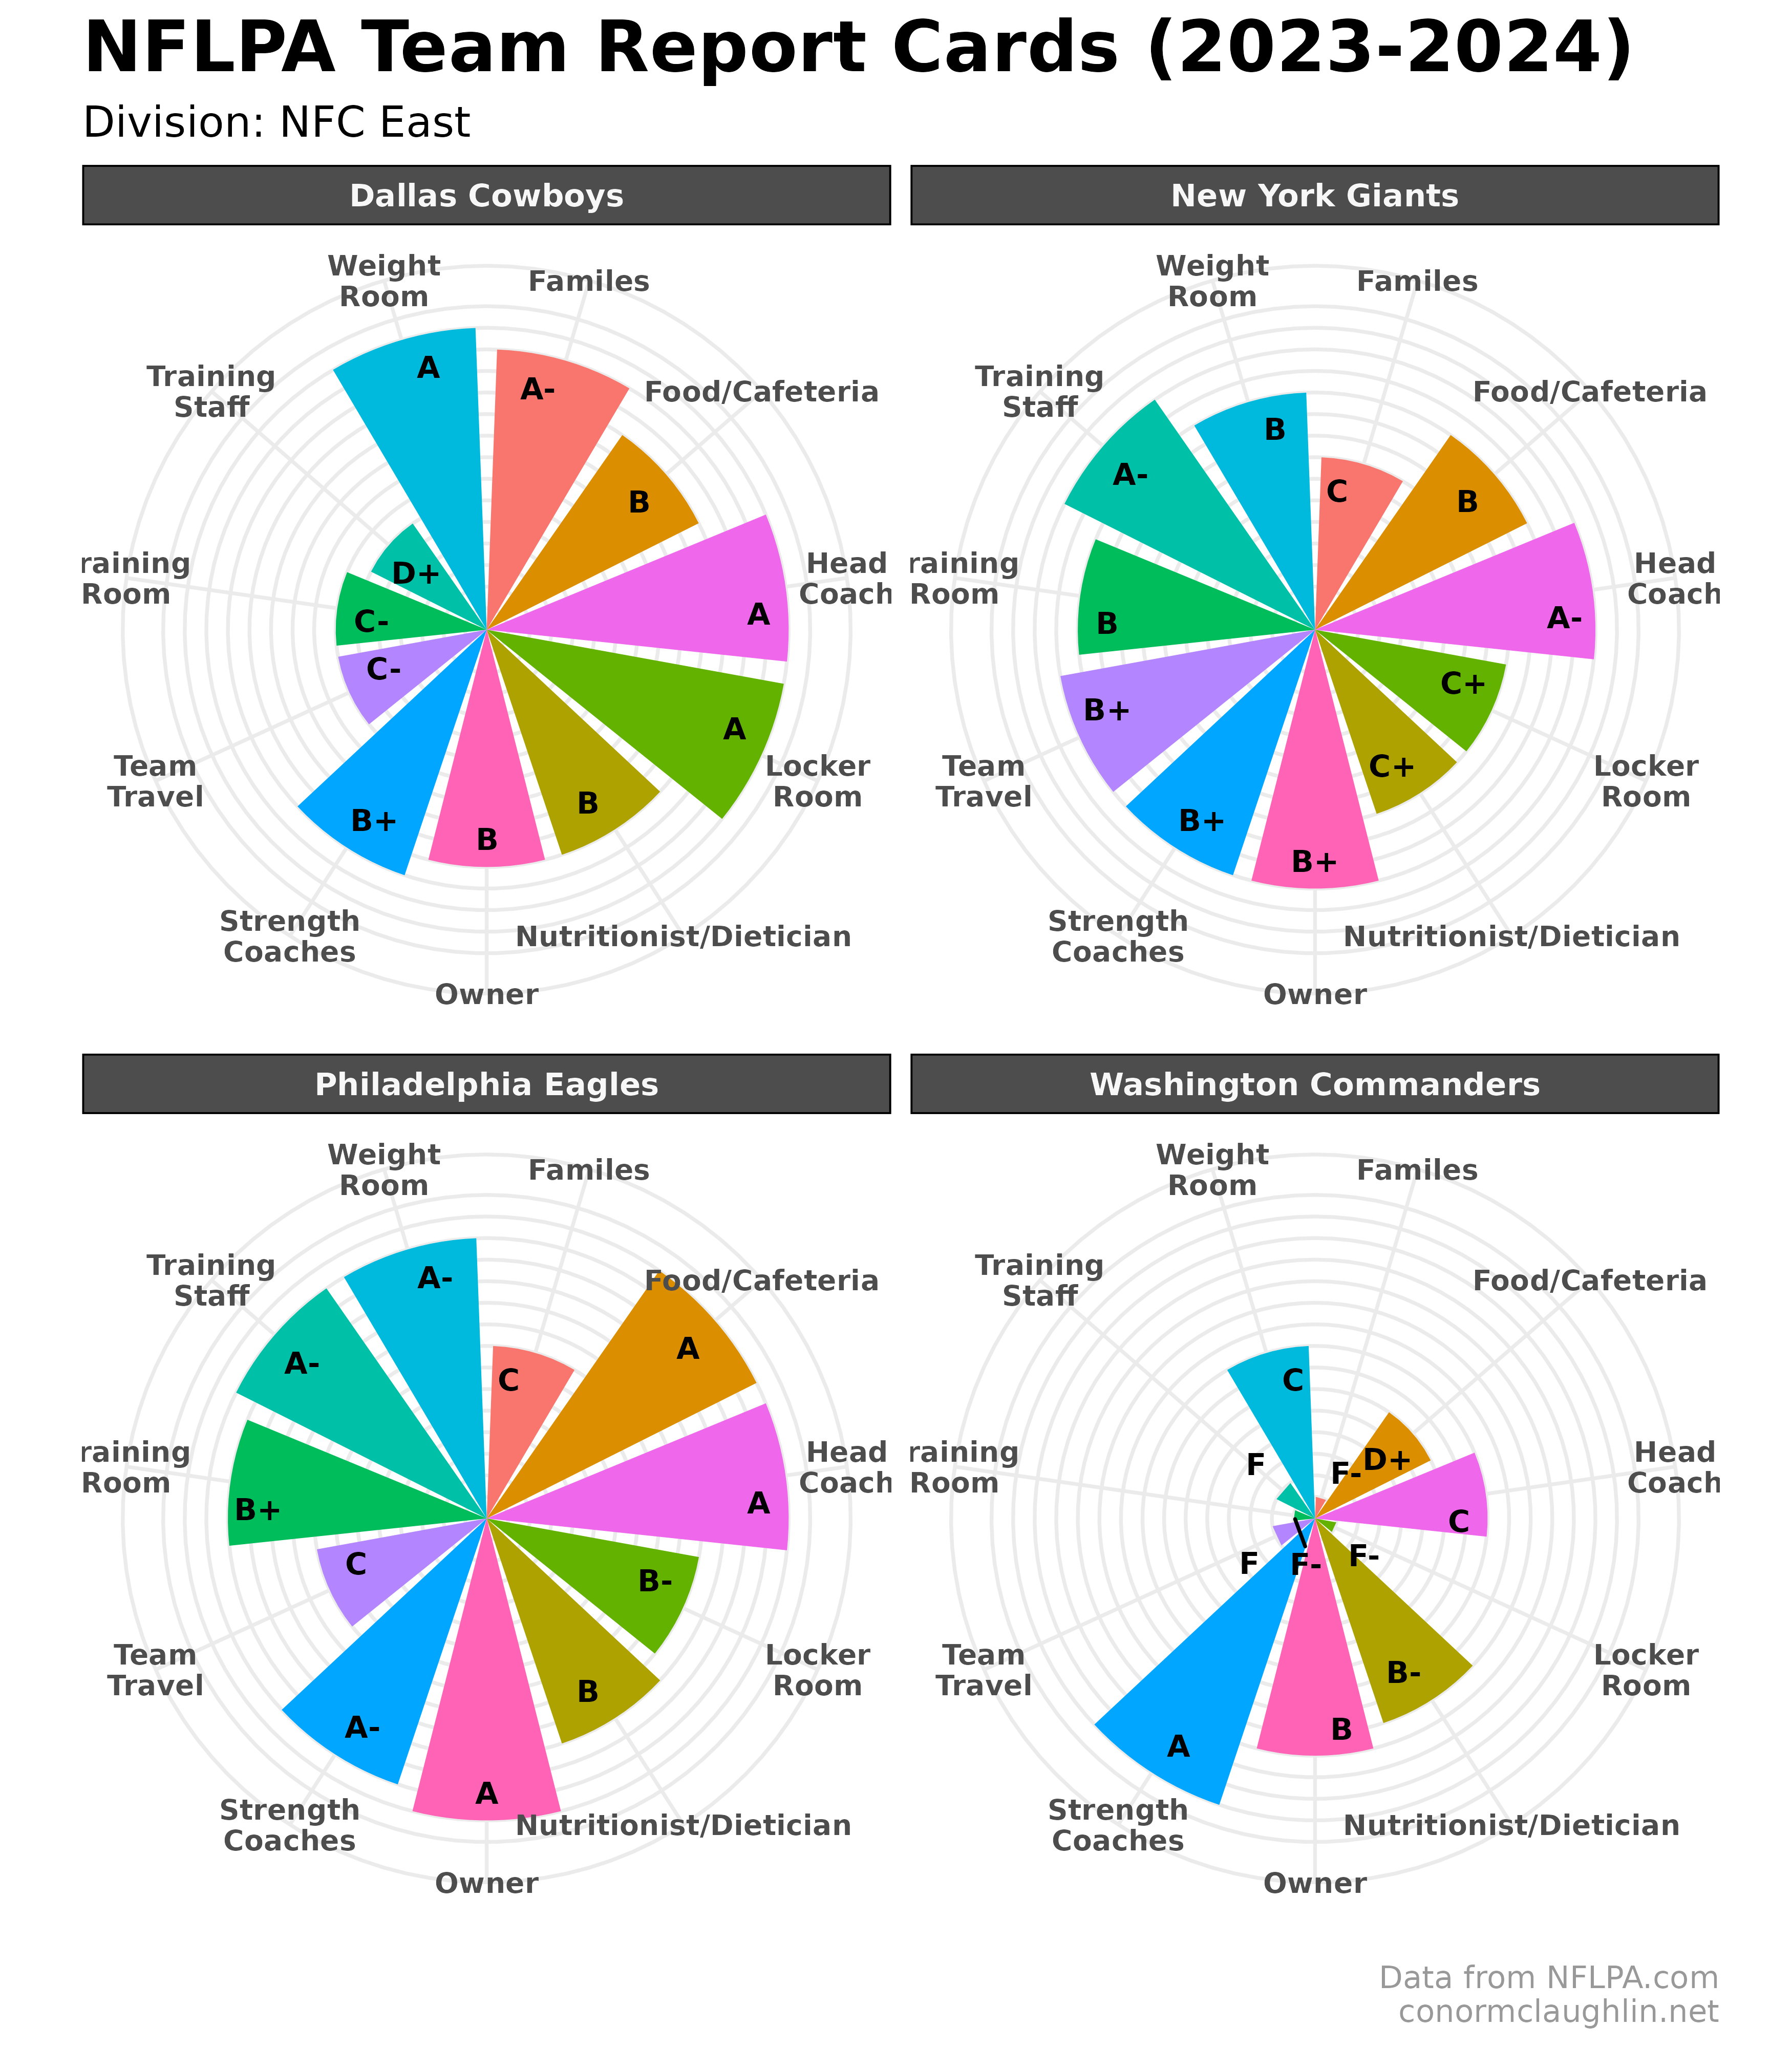
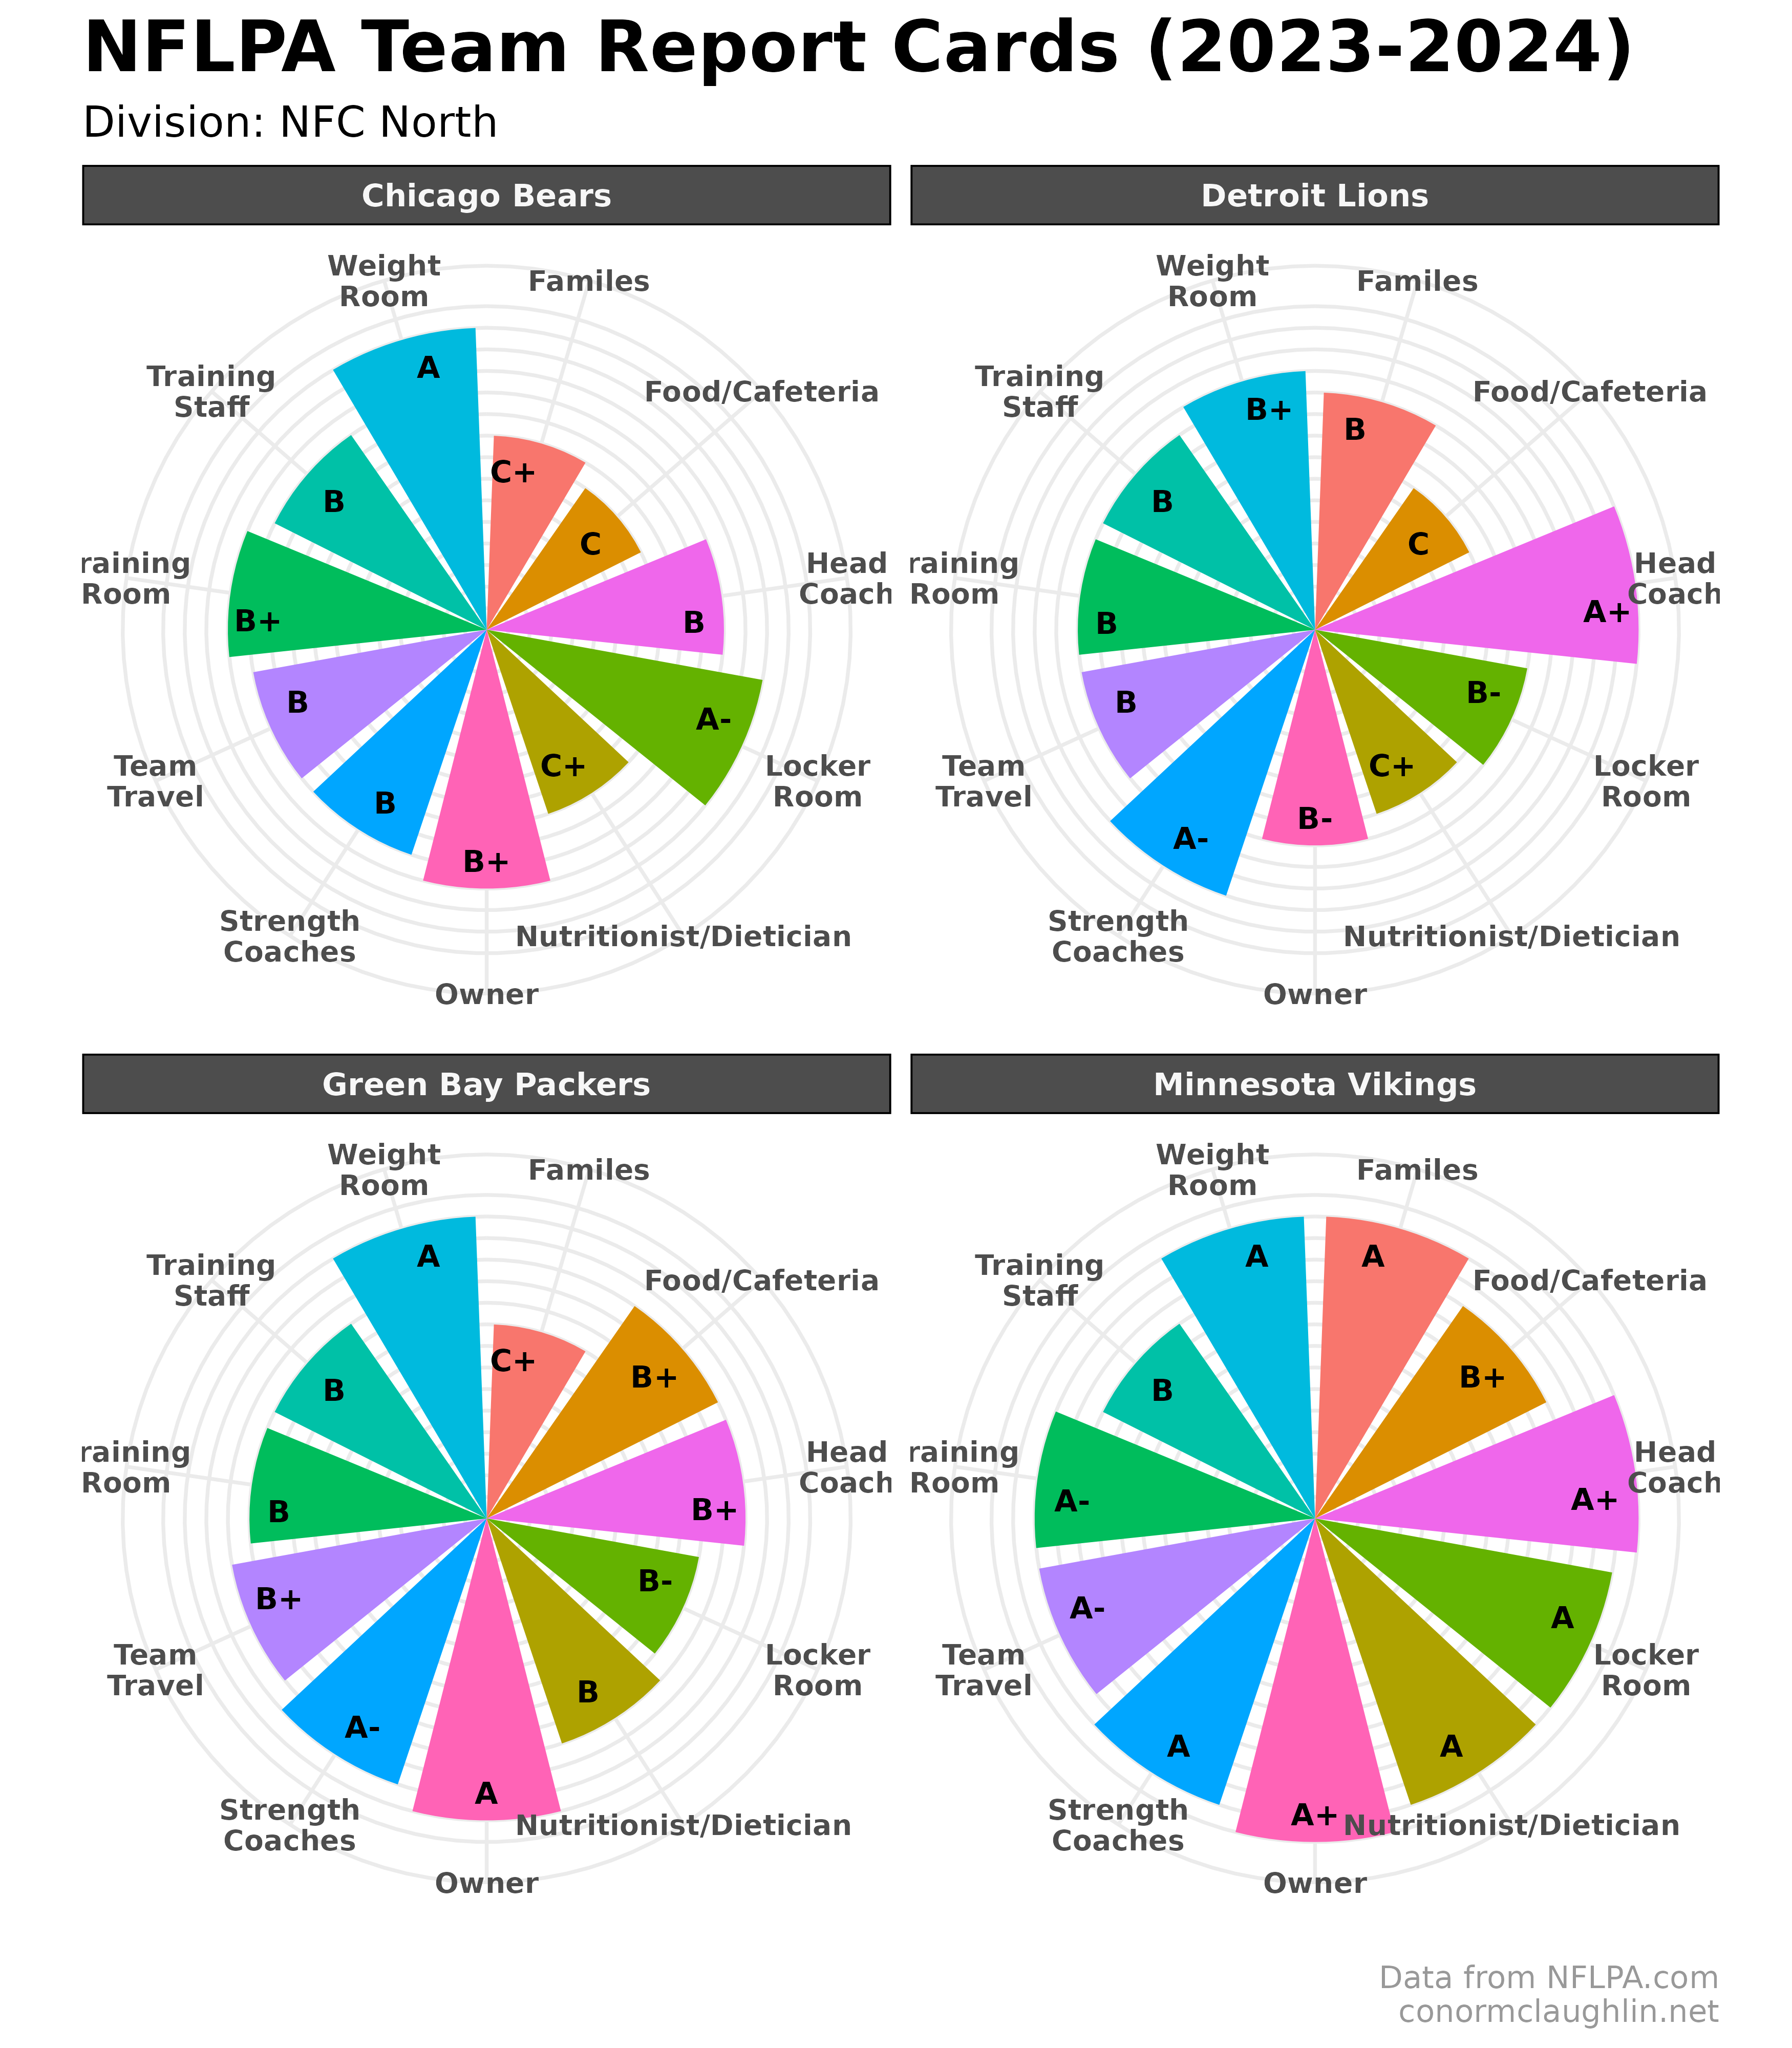
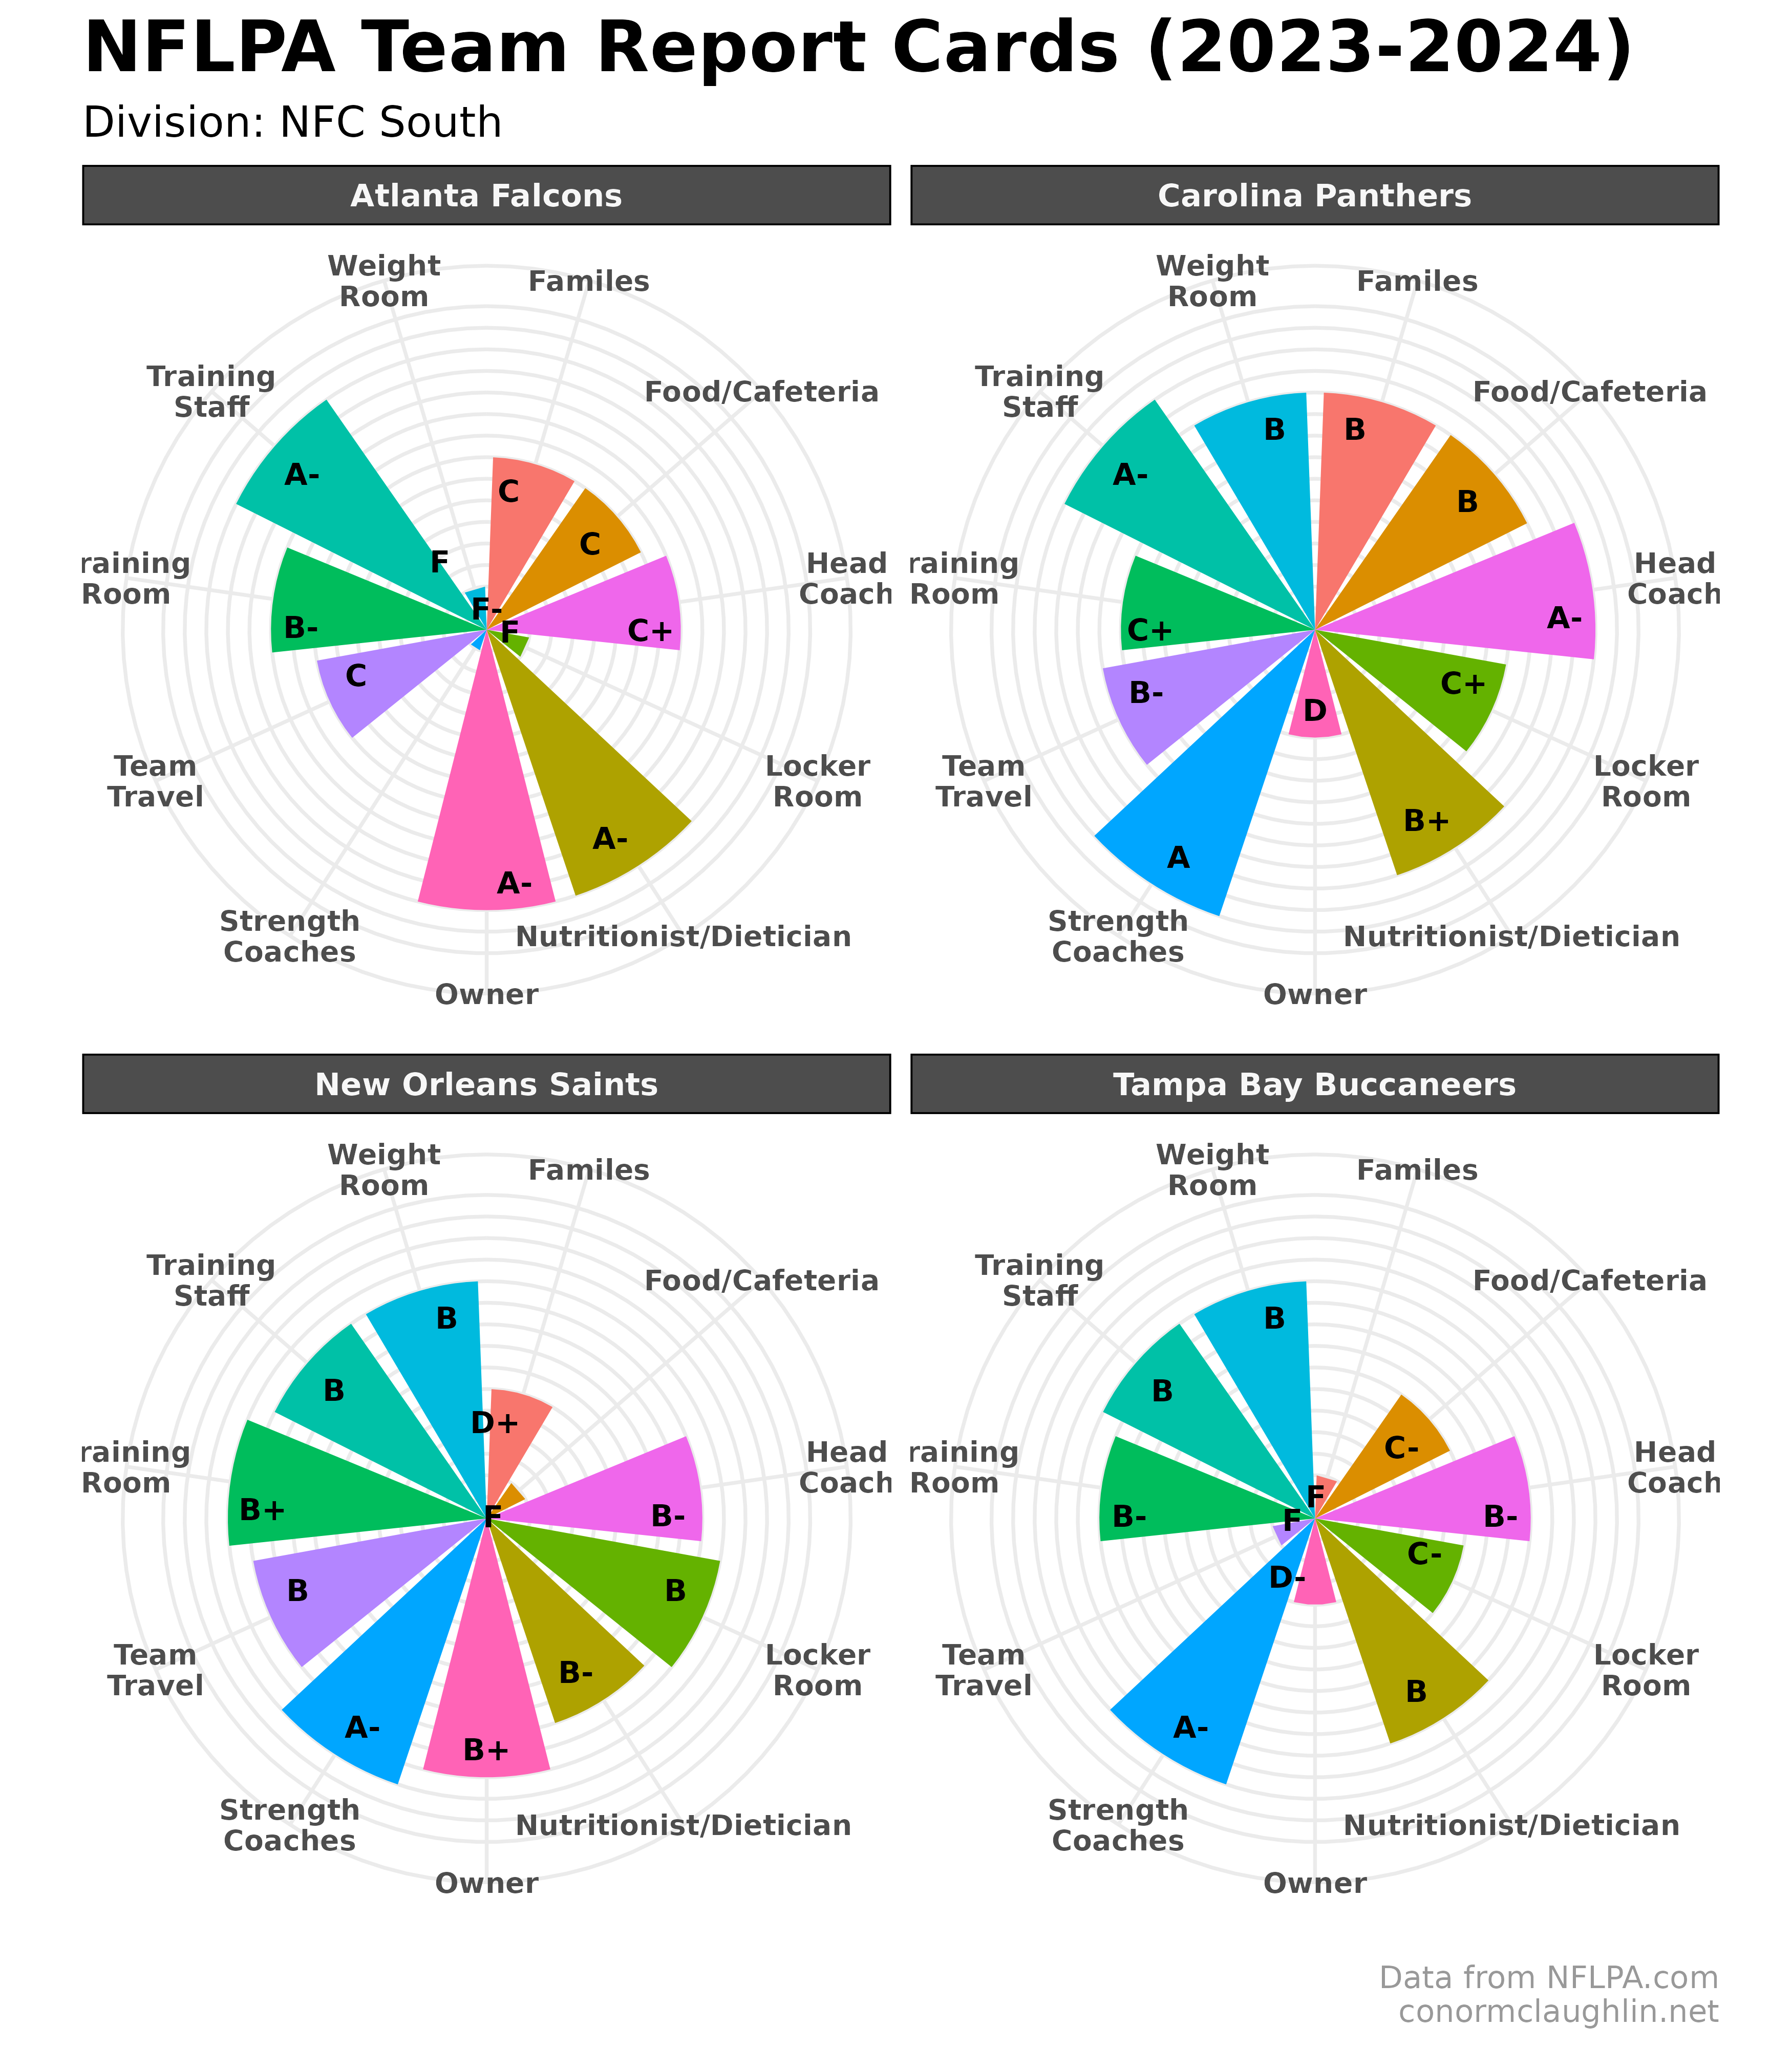
Divisional Circumplex Charts
If these look familiar, it’s because I copied a how-to that I wrote a few years ago to help with the base chart formatting - pretty fun!
AFC East
AFC North
AFC South
AFC West
NFC East
NFC North
NFC South
NFC West