Major League Baseball (MLB) has a long history of using the minors as a sandbox for rules reforms - with the recent testing and rollout of the pitch clock as a prime example.
This season, the “robo ump”, formally known as the automatic ball-strike (ABS) system, is being trialed across all of Triple-A. This system implements the strike zone as a rectangle set in the middle of the plate, measuring 17 inches wide and spanning between 27% and 53.5% of the batter’s height.
As a former baseball player and pitcher, I’ve always felt one of the more interesting elements of the game is the human-called strike zone: being able to pop the mitt with a fastball an inch off the plate with two strikes often “earns” a strikeout, a clear inconsistency from the rule book but nevertheless a consistent part of the game from Little League to High School to the Majors.
Furthermore, the presence of batters of varying heights means that the top and bottom of the zone are constantly being defining and redefining over the course of the game, in a four-way feedback loop between batter, pitcher, catcher, and umpire. While the ABS system has been tweaked to account for varying player heights, I’m still a bit skeptical that it’s “right” for both Aaron Judge and Jose Altuve…

However, I am sympathetic to the argument that the lack of rigor with the “informal” strike zone creates inconsistencies that detract from enjoyment of the game - I’ve written on this very blog about the frustration that poor umpiring can cause.
The Data
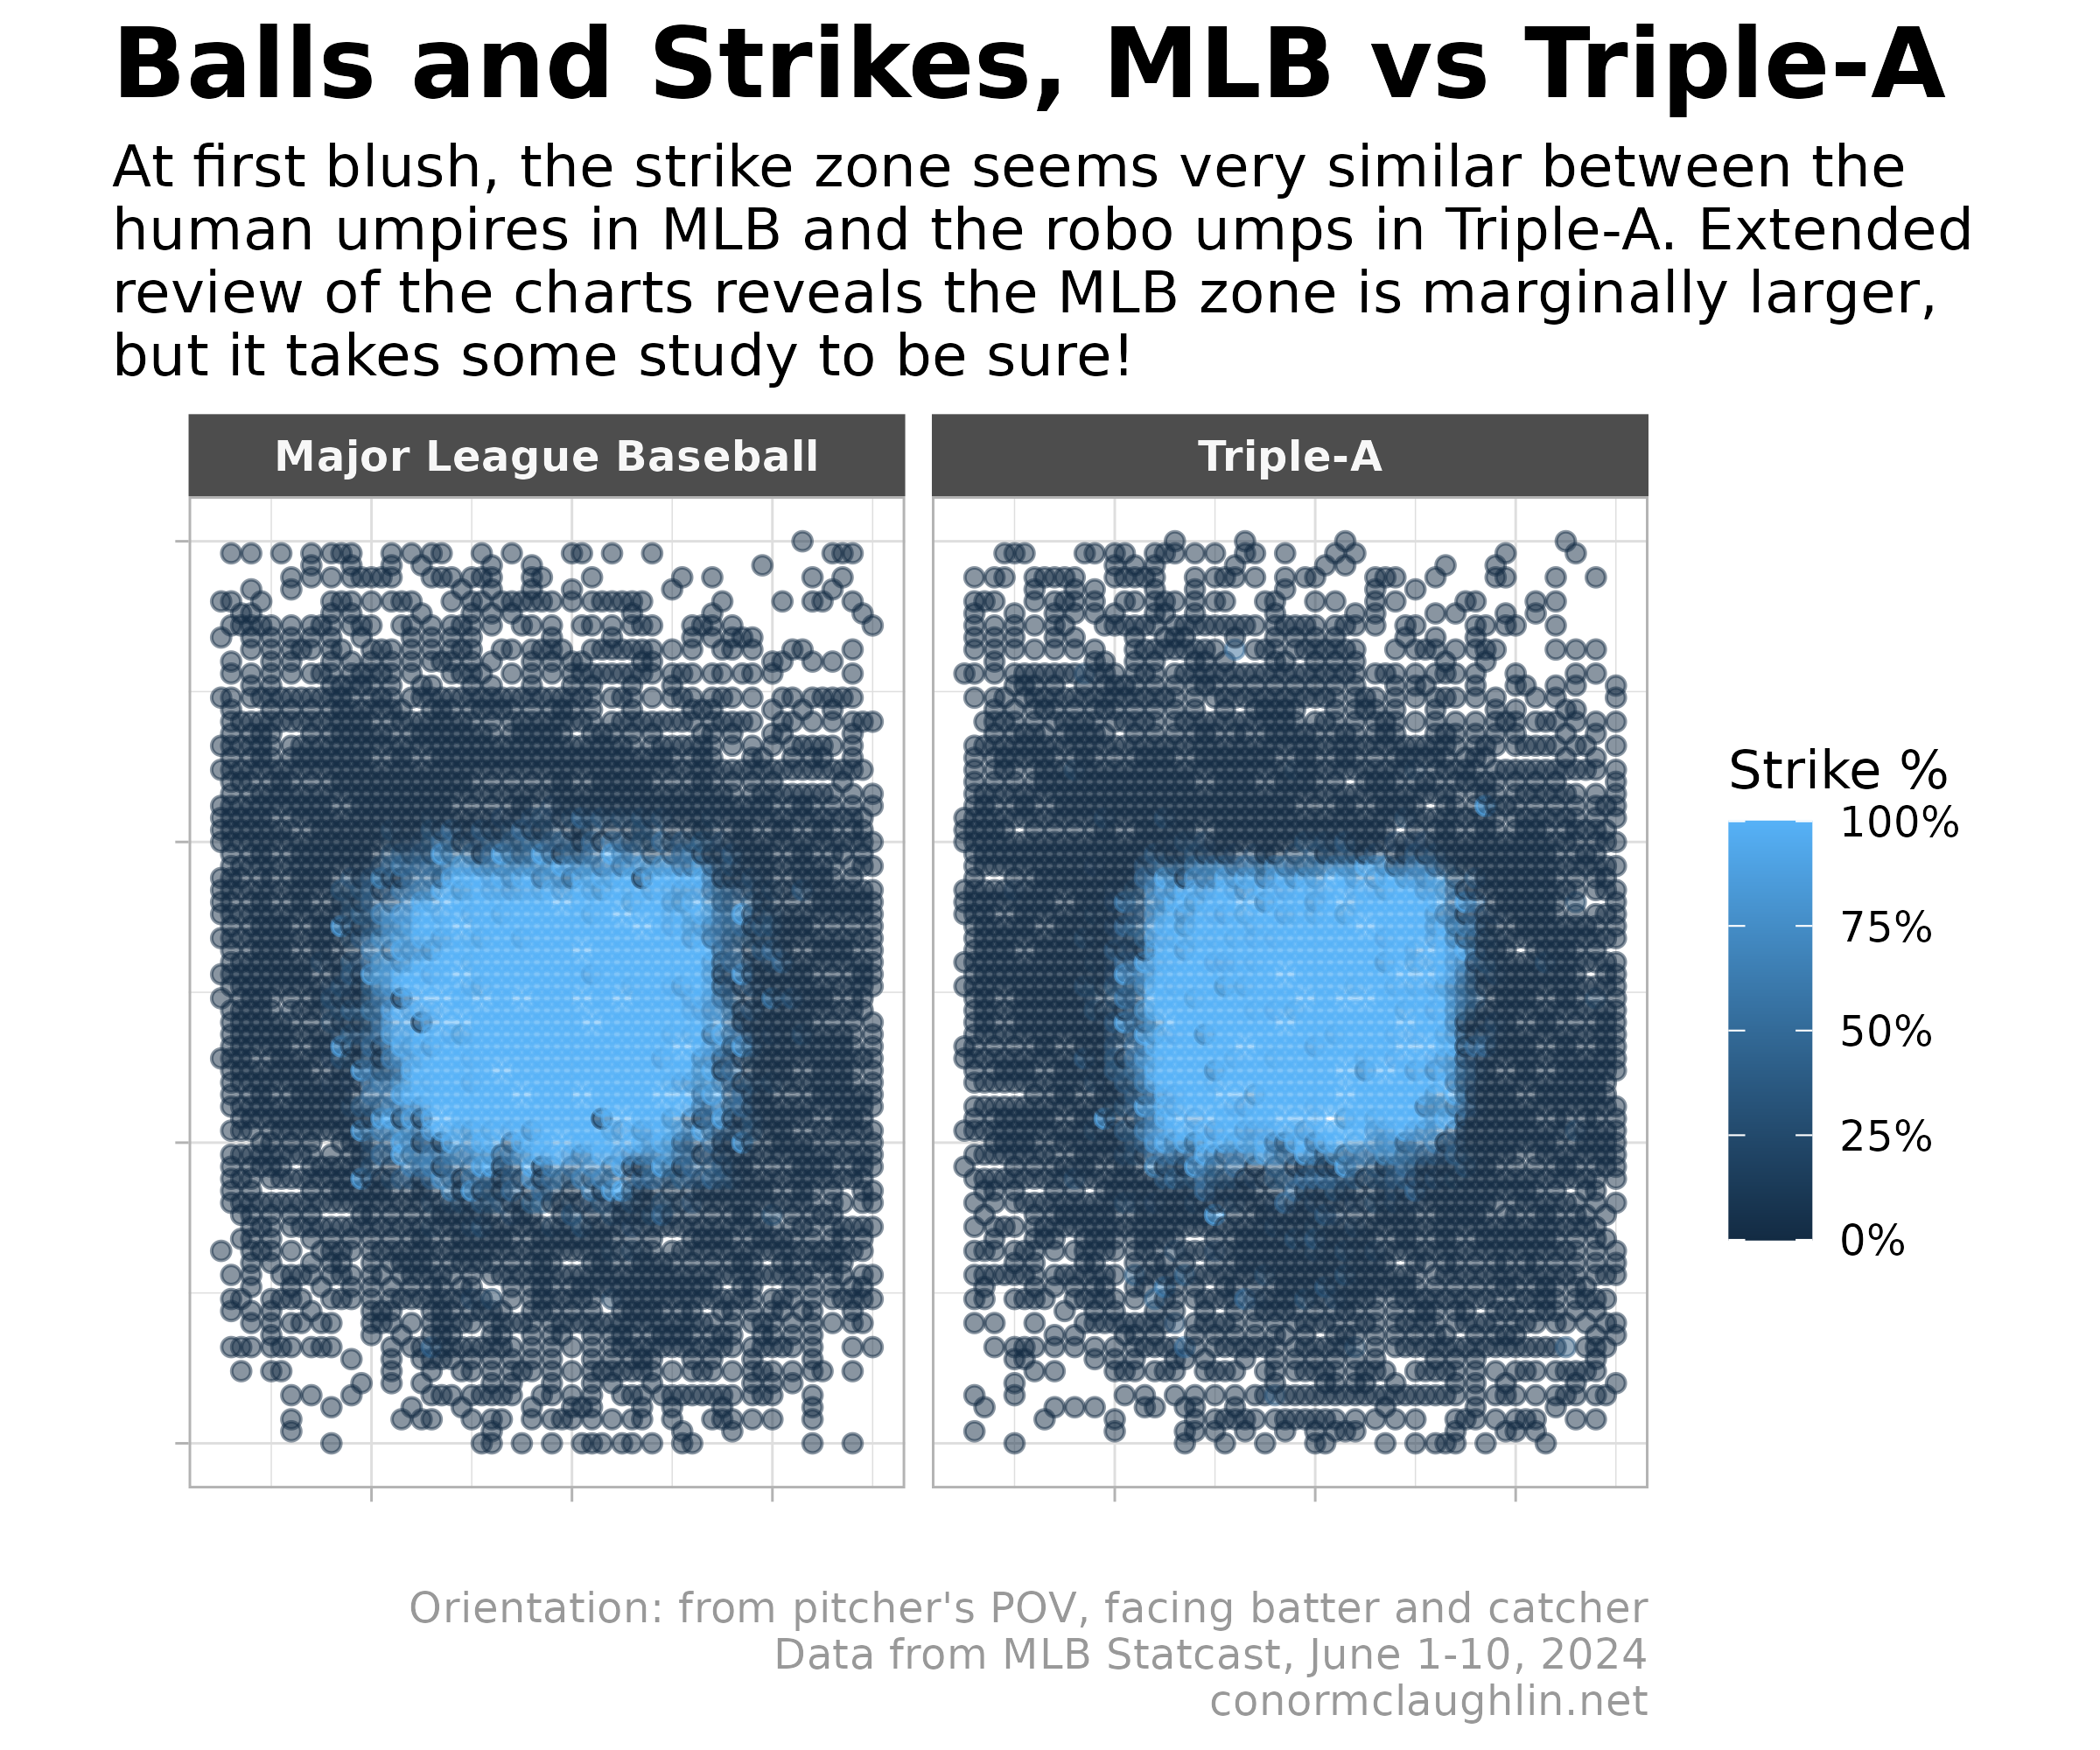
With all this in mind, I thought it would be an interesting exercise to gather pitch location data from Statcast and use it to visualize and compare the MLB and Triple-A strike zones.
We find that the Triple-A strike zone called by ABS is much tighter than the “human” zone, which is much more likely to expand around the edges and call pitches fractionally out of the zone as strikes, a decision the ABS system would never make.
Raw Strike Rate by League
Difference in Strike Rate Between Triple-A and MLB

Baseball’s Next Steps
On June 24th, MLB made a significant change to the deployment of ABS in Triple-A - deciding it would only be used as part of a challenge system, meaning it will no longer be used to call games full-time.
For my money, I’ve always favored this approach as the potential endgame for the big leagues… human umpires should call the game as they usually do, but teams should have a handful of ball/strike challenges each game to use to contest high-leverage calls they believe were missed and keep umpires accountable. We’ll see what Commissioner Manfred and the league office choose to do over the coming seasons!
Code Reference
Big thanks to Bill Petti for his Acquiring Minor League Pitch-by-Pitch data blog post, which I borrowed from to fetch the games and pitches through those vectorized map functions.
Acquire List of MLB and AAA Games
library(baseballr)
library(tidyverse)
library(purrr)

games <- map_df(.x = seq.Date(as.Date('2024-06-01'),
                          as.Date('2024-06-10'),
                          'day'),
            ~get_game_pks_mlb(date = .x, level_ids = c(1,11))
)

games <- games %>% select(game_pk, gameDate, teams.away.team.name, teams.home.team.name, status.codedGameState)
Fetch Pitch-by-Pitch Data for Games
safe_milb <- safely(get_pbp_mlb)

df <- map(.x = games %>%
            filter(status.codedGameState == "F") %>%
            pull(game_pk),
          ~safe_milb(game_pk = .x)) %>%
  map('result') %>%
  bind_rows()
Plot Strike Percentage per League
# Define the rounding function
round_to_nearest <- function(x, interval) {
  round(x / interval) * interval
}

df %>%
  filter(details.call.description %in% c("Called Strike", "Ball")) %>%
  filter(between(pitchData.coordinates.x, 50, 180)) %>%
  filter(between(pitchData.coordinates.y, 100, 250)) %>%
  select("details.call.description", "pitchData.coordinates.x", "pitchData.coordinates.y", "home_level_name") %>%
  mutate_if(is.numeric, ~round(., 0)) %>%
  mutate_if(is.numeric, ~round_to_nearest(., 2)) %>%
  group_by(pitchData.coordinates.x, pitchData.coordinates.y, home_level_name) %>%
  summarize(
    count = n(),
    strikes = sum(details.call.description == 'Called Strike'),
    balls = sum(details.call.description == 'Ball'),
    pct_strikes = sum(details.call.description == 'Called Strike') / n()
  ) %>%
  ggplot(aes(x = pitchData.coordinates.x, y = pitchData.coordinates.y, color = pct_strikes)) +
    geom_point(alpha = 0.5) +
    facet_wrap(~home_level_name) +
    scale_color_continuous(
      name = "Strike %",
      labels = scales::percent_format()
    ) +
    coord_fixed(1.2) +
    theme_light() +
    labs(x = "",
         y = "",
         title =  "Balls and Strikes, MLB vs Triple-A",
         subtitle = "At first blush, the strike zone seems very similar between the\nhuman umpires in MLB and the robo umps in Triple-A. Extended\nreview of the charts reveals the MLB zone is marginally larger,\nbut it takes some study to be sure!",
         caption = "Orientation: from pitcher's POV, facing batter and catcher\nData from MLB Statcast, June 1-10, 2024\nconormclaughlin.net"
    ) +
    theme(
      plot.title = element_text(size = 20, face = "bold"),
      plot.subtitle = element_text(size = 12),
      plot.caption = element_text(colour = "grey60"),
      strip.background = element_rect(fill = "grey30"),
      strip.text = element_text(color = "grey97", face = "bold"),
      axis.text = element_blank(),
      plot.title.position = "plot"
    )
Plot the Difference in Strike Percentage per Coordinate Cluster
library(RColorBrewer)

temp <- df %>%
  filter(details.call.description %in% c("Called Strike", "Ball")) %>%
  filter(between(pitchData.coordinates.x, 50, 180)) %>%
  filter(between(pitchData.coordinates.y, 100, 250)) %>%
  select("details.call.description", "pitchData.coordinates.x", "pitchData.coordinates.y", "home_level_name") %>%
  mutate_if(is.numeric, ~round(., 0)) %>%
  mutate_if(is.numeric, ~round_to_nearest(., 3)) %>%
  group_by(pitchData.coordinates.x, pitchData.coordinates.y, home_level_name) %>%
  summarize(
    count = n(),
    strikes = sum(details.call.description == 'Called Strike'),
    balls = sum(details.call.description == 'Ball'),
    pct_strikes = sum(details.call.description == 'Called Strike') / n()
  )

merge(
  x = temp %>% filter(home_level_name == 'Major League Baseball'),
  y = temp %>% filter(home_level_name == 'Triple-A'),
  by = c("pitchData.coordinates.x", "pitchData.coordinates.y"),
  all = FALSE
) %>%
  mutate(
    strike_diff_mlb_vs_aaa = pct_strikes.x - pct_strikes.y,
    strike_diff_aaa_vs_mlb = pct_strikes.y - pct_strikes.x
  ) %>%
  ggplot(aes(x = pitchData.coordinates.x, y = pitchData.coordinates.y, color = strike_diff_aaa_vs_mlb)) +
    geom_point(alpha = 0.8, size = 2) +
    coord_fixed(1.2) +
    scale_color_distiller(
      palette = "RdBu",
      name = "Diff in Strike %\nAAA vs MLB",
      labels = scales::percent_format()
    ) +
    theme_minimal() +
    labs(x = "",
         y = "",
         title =  "Triple A's Robo Umps Squeeze\nthe Corners",
         subtitle = "The Robo Umps calling balls and strikes for the 2024 Triple-A\nseason don't give extra inches on the corners, as MLB umpires\ncommonly do, resulting in a smaller effective strike zone.\nWe see a particularly pronounced difference on the outside edge\nof the strike zone for right-handed batters.",
         caption = "Orientation: from pitcher's POV, facing batter and catcher\nData from Statcast, June 1-10, 2024\nconormclaughlin.net"
    ) +
    theme(
      plot.title = element_text(size = 20, face = "bold"),
      plot.subtitle = element_text(size = 12),
      plot.caption = element_text(colour = "grey60"),
      #panel.grid.major = element_blank(),
      #panel.grid.minor = element_blank(),
      axis.text = element_blank(),
      plot.title.position = "plot"
    )