With the NFL season right around the corner, I thought it would be fun to preview the potential impact of one of the biggest rule changes the NFL has made.
Anyone who has watched football in the past decade knows that kickoffs have been a “dead” play - kickers are so good at generating touchbacks that we rarely see returns, formerly one of most fun plays in the game. Furthermore, when returns do happen, injury rates have been concerningly high, with tacklers and blockers colliding at high speeds after long run-ups.
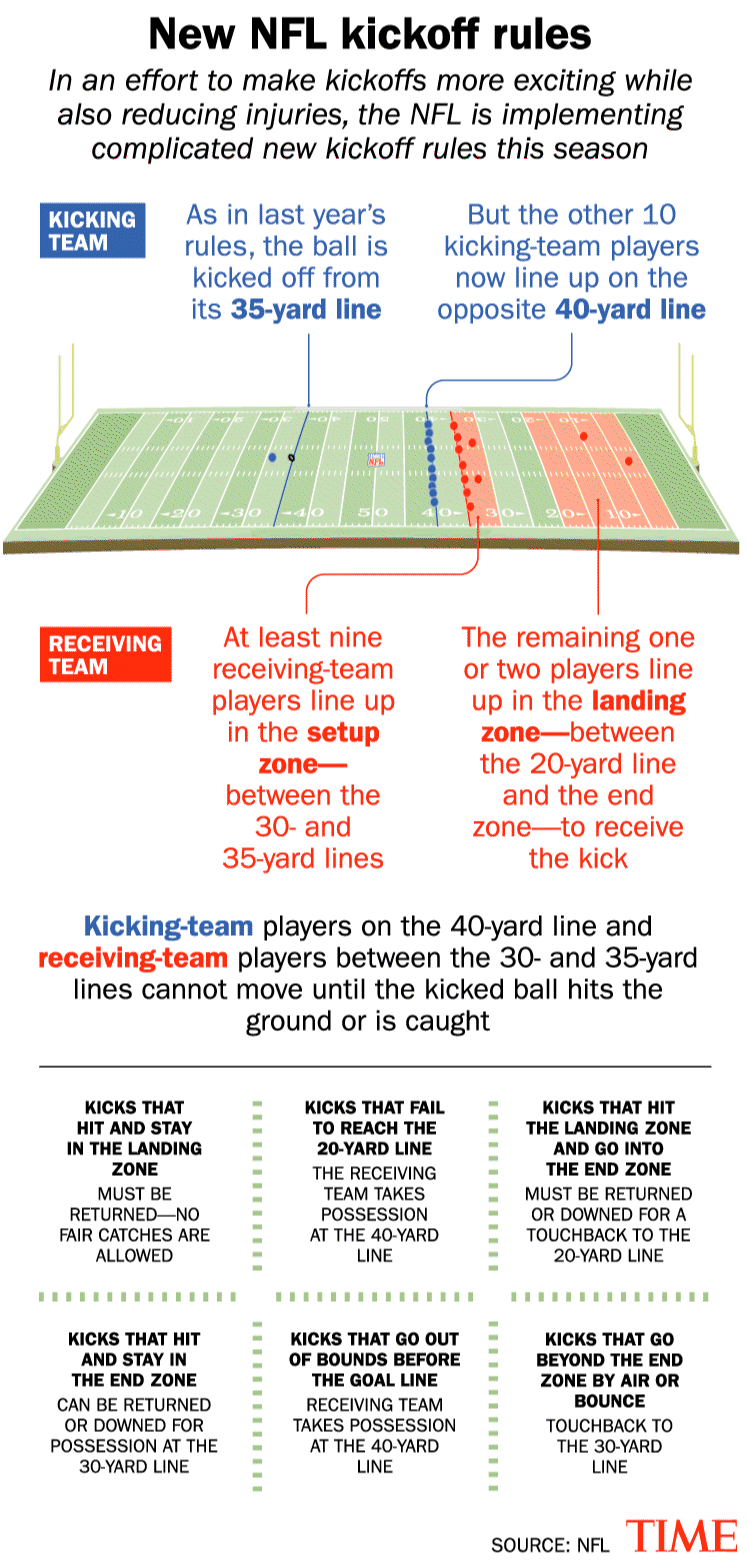
In a reform attempt targeting corrections to both of these negative trends, the NFL is significantly changing how kickoffs will work, stealing from the XFL. The NFL Rule Book has a full explanation, but I really liked this infographic that TIME magazine put together to explain the new mechanics:
Game Impact
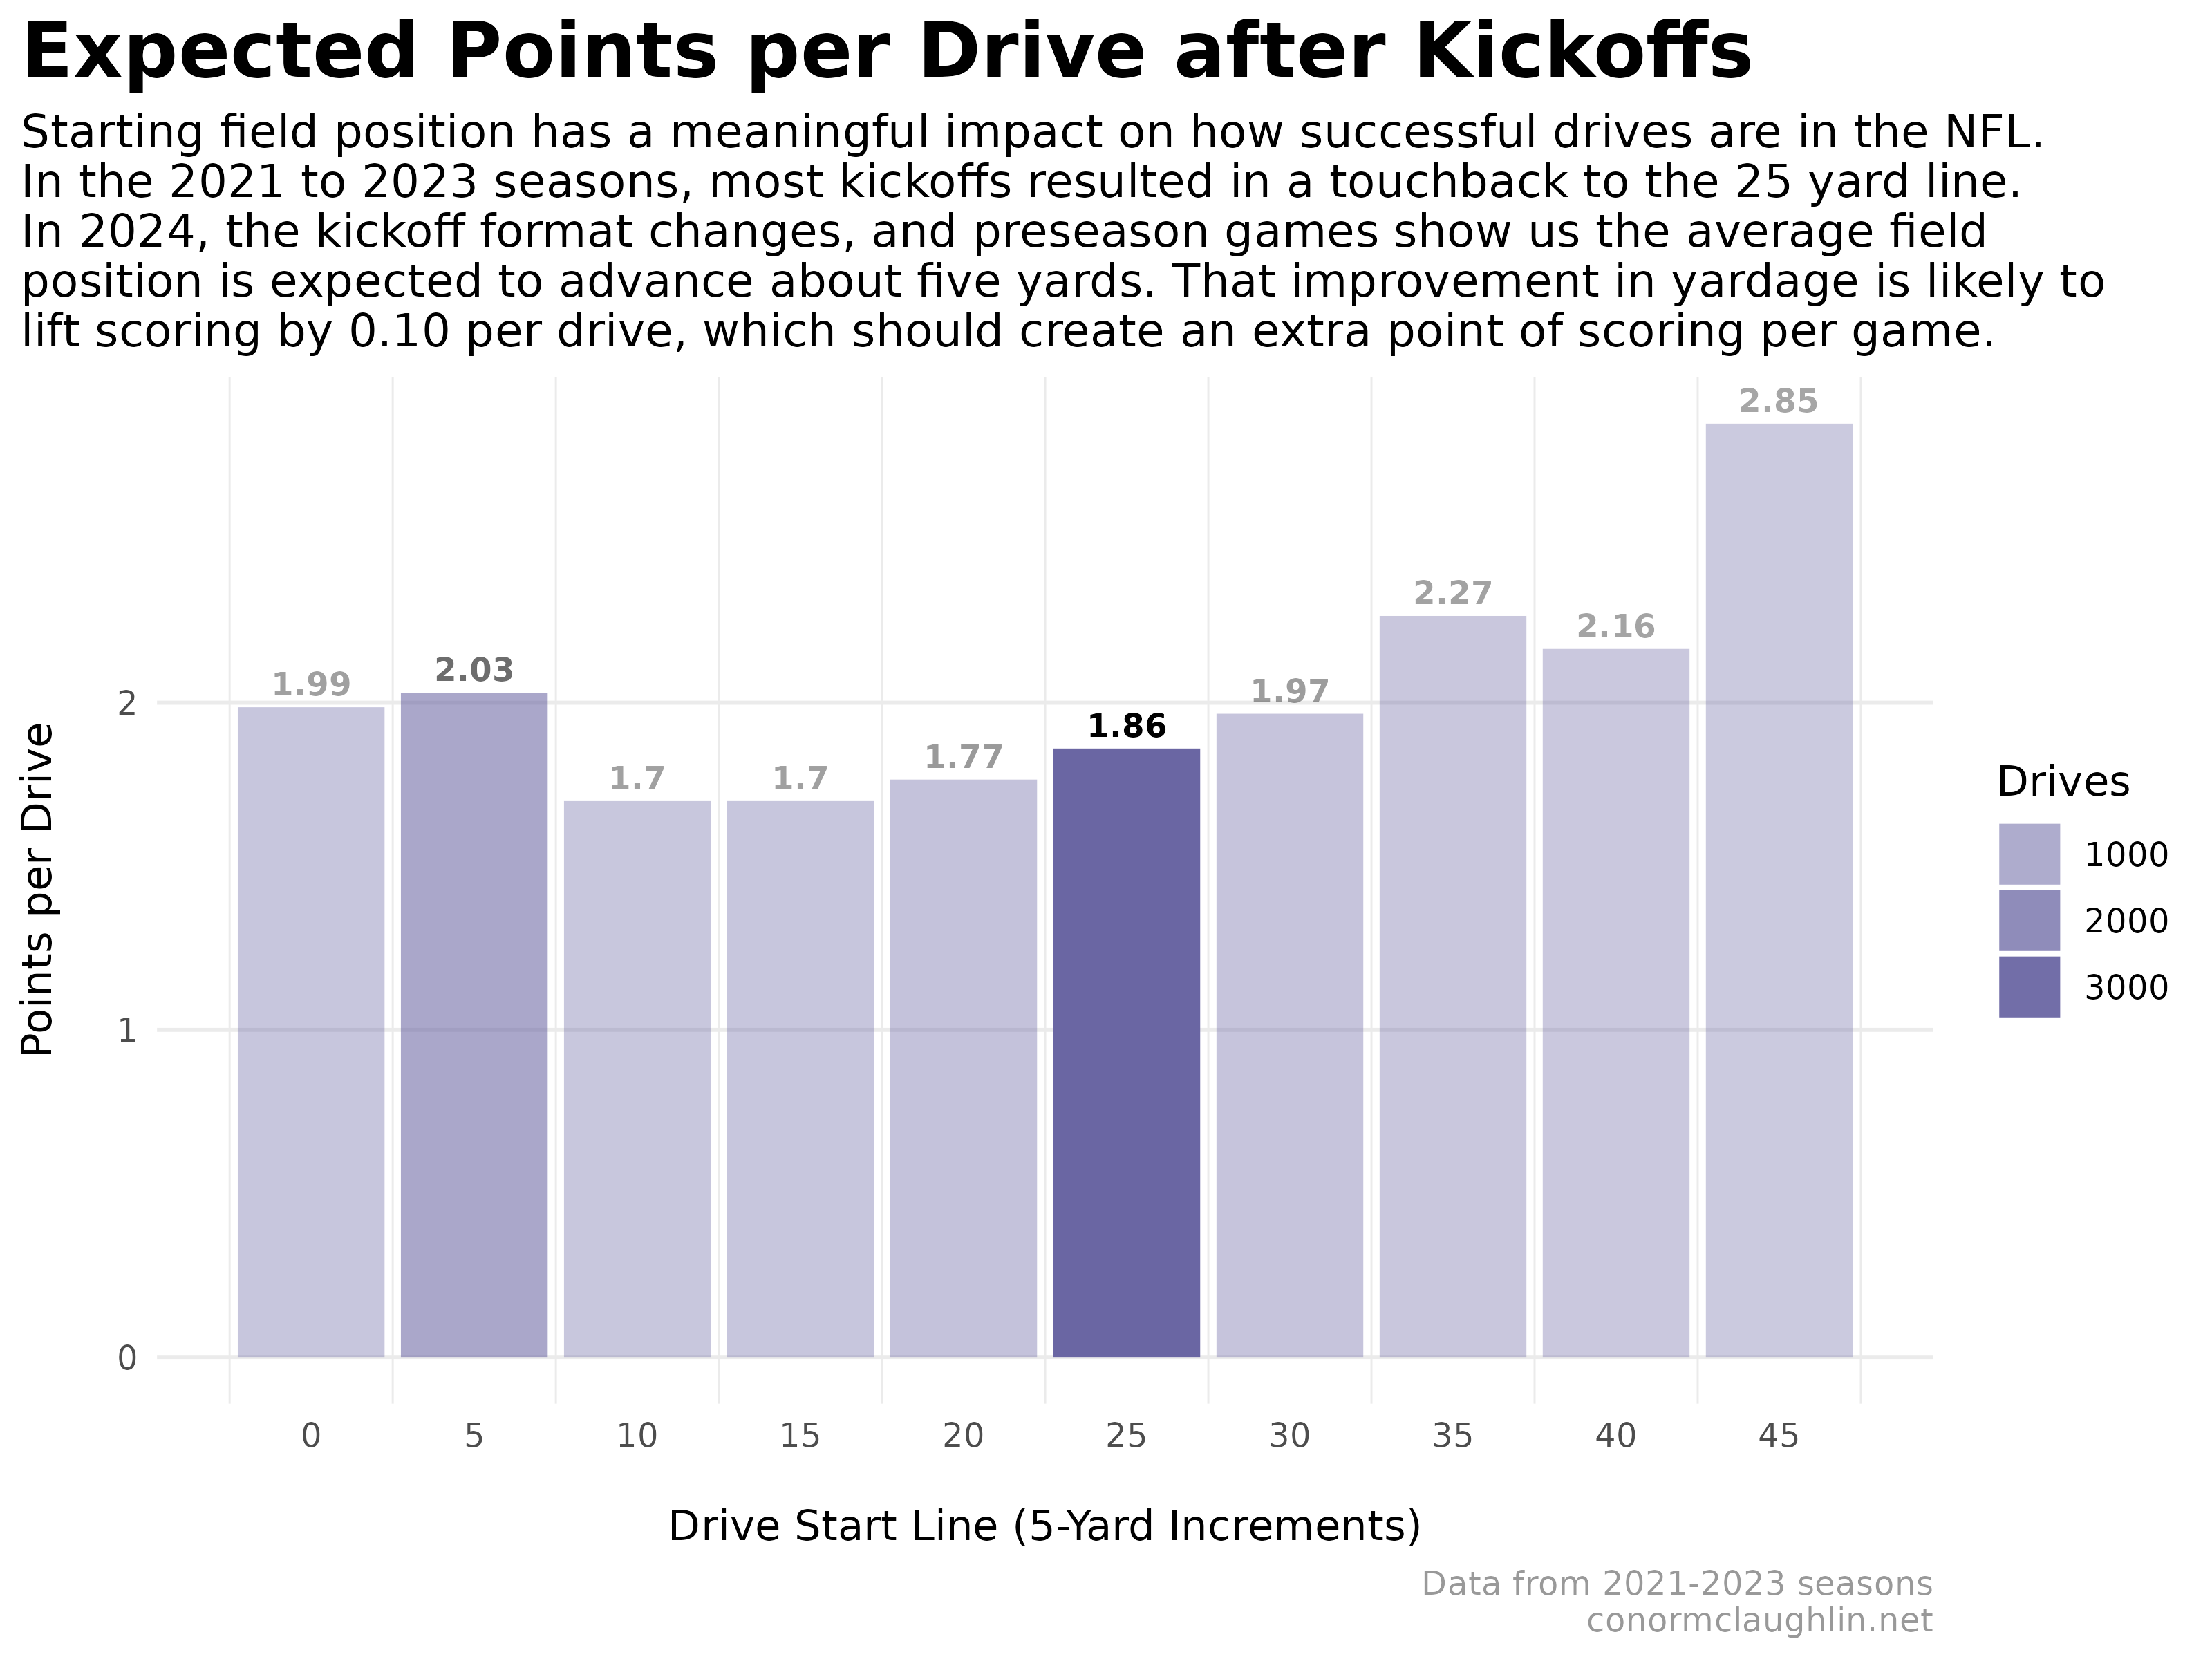
A friend of mine tipped me off that the effect of the new kickoffs was immediately visible in this season’s preseason games, with average starting field position about five yards closer than in the past. My mind naturally gravitated toward how this might impact scoring, since one generally assumes that drives with better field position result in more points.
To provide some context to this, I built a visualization that shows the expected points per drive as a function of field position after kickoffs, with yardage chunked in five yard increments (0-5, 5-10, etc.). The data shows that the five yard improvement in field position may translate into ~0.10 more points per drive - nothing crazy, but not trivial either!
Code Reference
Fetch Play by Play Data
I’d like to give a big shoutout to the nflreadr package for R, which makes it really easy to source and load play-by-play historic data for NFL games!
library(tidyverse)
library(nflreadr)

# Specify years
years <- 2021:2023

# Load and bind data frames
all_data <- lapply(years, function(year) {
  load_pbp(year)  # Replace with your data loading function
}) %>%
  bind_rows()
Summarize Drive-Level Data
# Summarize drives
drives <- all_data %>%
  filter(!is.na(drive)) %>%
  filter(!is.na(posteam)) %>%
  group_by(game_id, drive, posteam, defteam, drive_start_transition, drive_start_yard_line, drive_end_yard_line, drive_ended_with_score) %>%
  summarize(
    touchdowns = sum(touchdown, na.rm = TRUE),
    fgs = sum(field_goal_result == "made", na.rm = TRUE),
    exps = sum(extra_point_result == "good", na.rm = TRUE),
    two_pt = sum(two_point_conv_result == "success", na.rm = TRUE)
  ) %>%
  mutate(
    points = touchdowns * 6 + fgs * 3 + exps * 1 + two_pt * 2,
    abs_drive_start_yard_line = ifelse(substring(drive_start_yard_line, 1, 3) == defteam, 100 - as.integer(substring(drive_start_yard_line, 5, 6)), as.integer(substring(drive_start_yard_line, 5, 6)))
  )
Visualize Points per Drive as a Function of Field Position, after Kickoffs
drives %>%
  filter(drive_start_transition == "KICKOFF") %>%
  mutate(rounded_abs_drive_start_yard_line = round(abs_drive_start_yard_line / 5) * 5) %>%
  group_by(rounded_abs_drive_start_yard_line) %>%
  summarize(
    count = n(),
    avg_points = mean(points)
  ) %>%
  filter(rounded_abs_drive_start_yard_line < 50) %>%
  ggplot(aes(x = rounded_abs_drive_start_yard_line, y = avg_points, alpha = count, label = round(avg_points, 2))) +
    geom_col(fill = "#6A66A3") +
    geom_text(vjust = -0.5, show.legend = FALSE, size = 3, fontface = "bold") +
    scale_x_continuous(breaks = seq(0,50,5)) +
    scale_alpha_continuous(range = c(0.35, 1.0), name = "Drives") +
    theme_minimal() +
    theme(
      legend.background = element_rect(color = NA),
      plot.title = element_text(size = 20, face = "bold"),
      plot.subtitle = element_text(size = 12),
      plot.caption = element_text(colour = "grey60"),
      plot.title.position = "plot",
      panel.grid.major.x = element_blank(),
      panel.grid.minor.y = element_blank()
    ) +
    labs(
      x = "\nDrive Start Line (5-Yard Increments)",
      y = "Points per Drive\n",
      title =  "Expected Points per Drive after Kickoffs",
      subtitle = "Starting field position has a meaningful impact on how successful drives are in the NFL.\nIn the 2021 to 2023 seasons, most kickoffs resulted in a touchback to the 25 yard line.\nIn 2024, the kickoff format changes, and preseason games show us the average field\nposition is expected to advance about five yards. That improvement in yardage is likely to\nlift scoring by 0.10 per drive, which should create an extra point of scoring per game.",
      caption = "Data from 2021-2023 seasons\nconormclaughlin.net"
    )