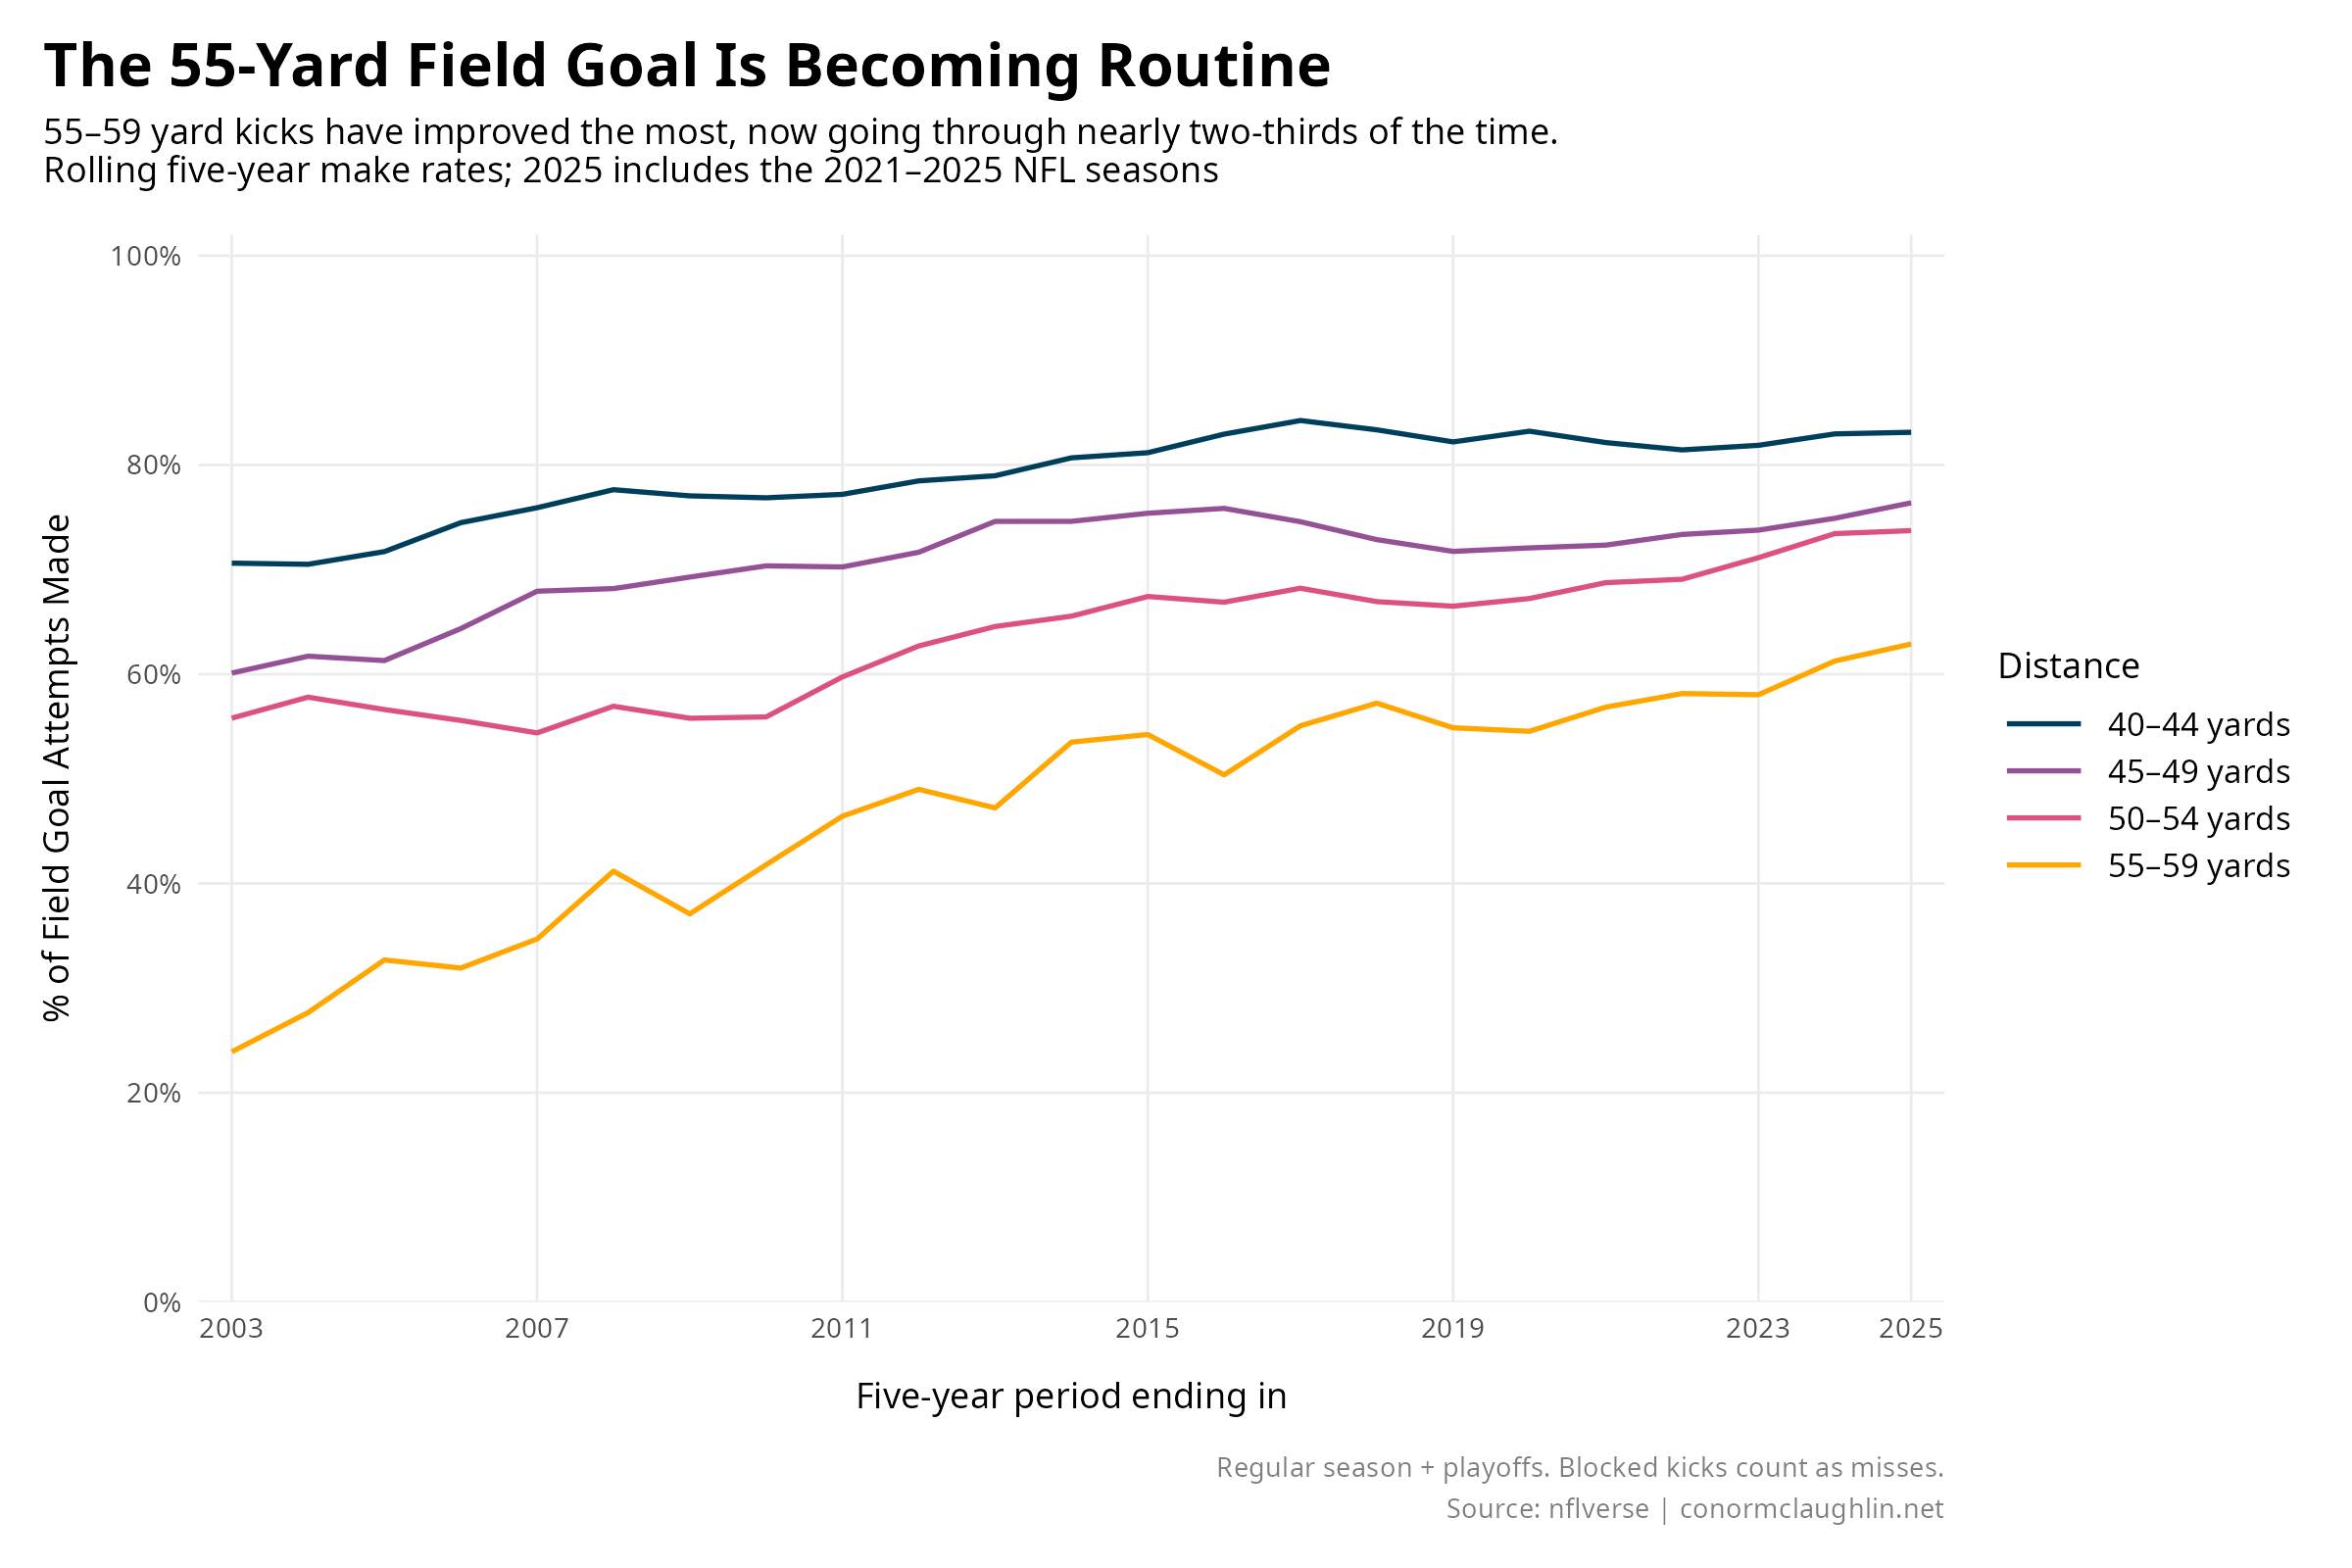
Twenty-five years ago, NFL kickers made fewer than one in four field goal attempts from 55–59 yards. Now they’re making nearly two in three.
After reading my January 2025 post on kicker accuracy, which first laid out that improvement, a reader reached out to me and requested another visual: put time on the x-axis, make rate on the y-axis, and give each distance range its own line. With football season underway, I’ve finally gotten back to that idea and have a fresh new plot to share with you all - I think it turned out nicely!
Visualizations
The chart below follows four distance ranges, from 40–44 yards through 55–59 yards, on a rolling five-year basis. Each year on the x-axis marks the end of a five-season period: the 2025 point includes attempts from 2021–2025, for example.
What Stands Out
- Success on 55–59 yard kicks has climbed over time and continues to rise slowly: they’ve gone from desperation attempts to something kickers can realistically make
- The 45–49 and 50–54 yard lines have increased by roughly the same amount over the time window, showing a general improvement in accuracy
- To me, the contrast suggests the improvement from 55–59 yards is more about gains in the capacity to hit that distance, while the shorter kicks are about accuracy gains at distances kickers could already reach
Code Reference
I used nflreadr to quickly pull in the play-by-play data - kudos to nflverse for making this accessible.
Load the Data
library(dplyr)
library(purrr)
library(ggplot2)

all_kicks <- map_dfr(1999:2025, function(year) {
  pbp <- nflreadr::load_pbp(year, file_type = "csv")
  if (!"play_deleted" %in% names(pbp)) pbp$play_deleted <- 0

  pbp %>%
    filter(field_goal_attempt == 1) %>%
    select(season, season_type, field_goal_result, kick_distance,
           play_deleted, desc)
})
Prepare the Attempts
kicks <- all_kicks %>%
  filter(season_type %in% c("REG", "POST"),
         field_goal_result %in% c("made", "missed", "blocked"),
         !is.na(kick_distance), coalesce(play_deleted, 0) != 1,
         !grepl("No Play", coalesce(desc, ""), ignore.case = TRUE)) %>%
  mutate(made = field_goal_result == "made",
         distance = floor(kick_distance / 5) * 5) %>%
  filter(distance %in% c(40, 45, 50, 55))
Rolling Five Year Make Rates
rolling <- map_dfr(2003:2025, function(end_season) {
  kicks %>%
    filter(between(season, end_season - 4, end_season)) %>%
    group_by(distance) %>%
    summarise(attempts = n(), makes = sum(made), .groups = "drop") %>%
    mutate(year = end_season, make_rate = makes / attempts)
}) %>%
  mutate(distance = factor(paste0(distance, "–", distance + 4, " yards")))
Build the Chart
p <- ggplot(rolling, aes(year, make_rate, colour = distance)) +
  geom_line(linewidth = 0.9) +
  scale_colour_manual(
    values = c("#003f5c", "#955196", "#dd5182", "#ffa600"),
    name = "Distance") +
  scale_x_continuous(breaks = c(2003, 2007, 2011, 2015, 2019, 2023, 2025),
                     limits = c(2003, 2025), expand = expansion(mult = 0.02)) +
  scale_y_continuous(labels = scales::label_percent(accuracy = 1),
                     breaks = seq(0, 1, 0.2), limits = c(0, 1),
                     expand = expansion(mult = c(0, 0.02))) +
  theme_minimal(base_size = 13, base_family = "sans") +
  theme(
    panel.grid.minor = element_blank(),
    panel.grid.major = element_line(colour = "grey92", linewidth = 0.45),
    plot.title = element_text(size = 22, face = "bold", colour = "black"),
    plot.subtitle = element_text(size = 13, margin = margin(b = 16)),
    plot.caption = element_text(size = 10, colour = "grey50", hjust = 1,
                                lineheight = 1.25, margin = margin(t = 15)),
    plot.title.position = "plot", axis.title.x = element_text(margin = margin(t = 14)),
    axis.title.y = element_text(margin = margin(r = 12)),
    legend.title = element_text(size = 13), legend.text = element_text(size = 12),
    legend.key.width = grid::unit(1.2, "cm"),
    legend.spacing.y = grid::unit(0.2, "cm"),
    plot.margin = margin(16, 16, 16, 16)) +
  labs(
    x = "Five-year period ending in",
    y = "% of Field Goal Attempts Made",
    title = "The 55-Yard Field Goal Is Becoming Routine",
    subtitle = paste0("55\u201359 yard kicks have improved the most, now going through nearly two-thirds of the time.\n",
                      "Rolling five-year make rates; 2025 includes the 2021\u20132025 NFL seasons"),
    caption = paste0("Regular season + playoffs. Blocked kicks count as misses.\n",
                     "Source: nflverse | conormclaughlin.net"))

p