It was in mid-March that I started hearing the rumblings, lunchtime comments from ski and snowboard friends at work:
“I wanted to go up to Mammoth this weekend, but decided to skip it since there just isn’t much good snow”
“We went to Tahoe but I kind of wish we hadn’t since it was really slushy”
I have to admit, I initially gaffed these comments off. Surely a little less pow was just a first world problem??
Unfortunately, after reading some troubling reporting on the March heatwave that rolled across the country, it began to dawn that this was actually an ecological disaster in the makings - one that is going to have massive impacts on water supplies in the American West, which rely heavily on snow run-off.
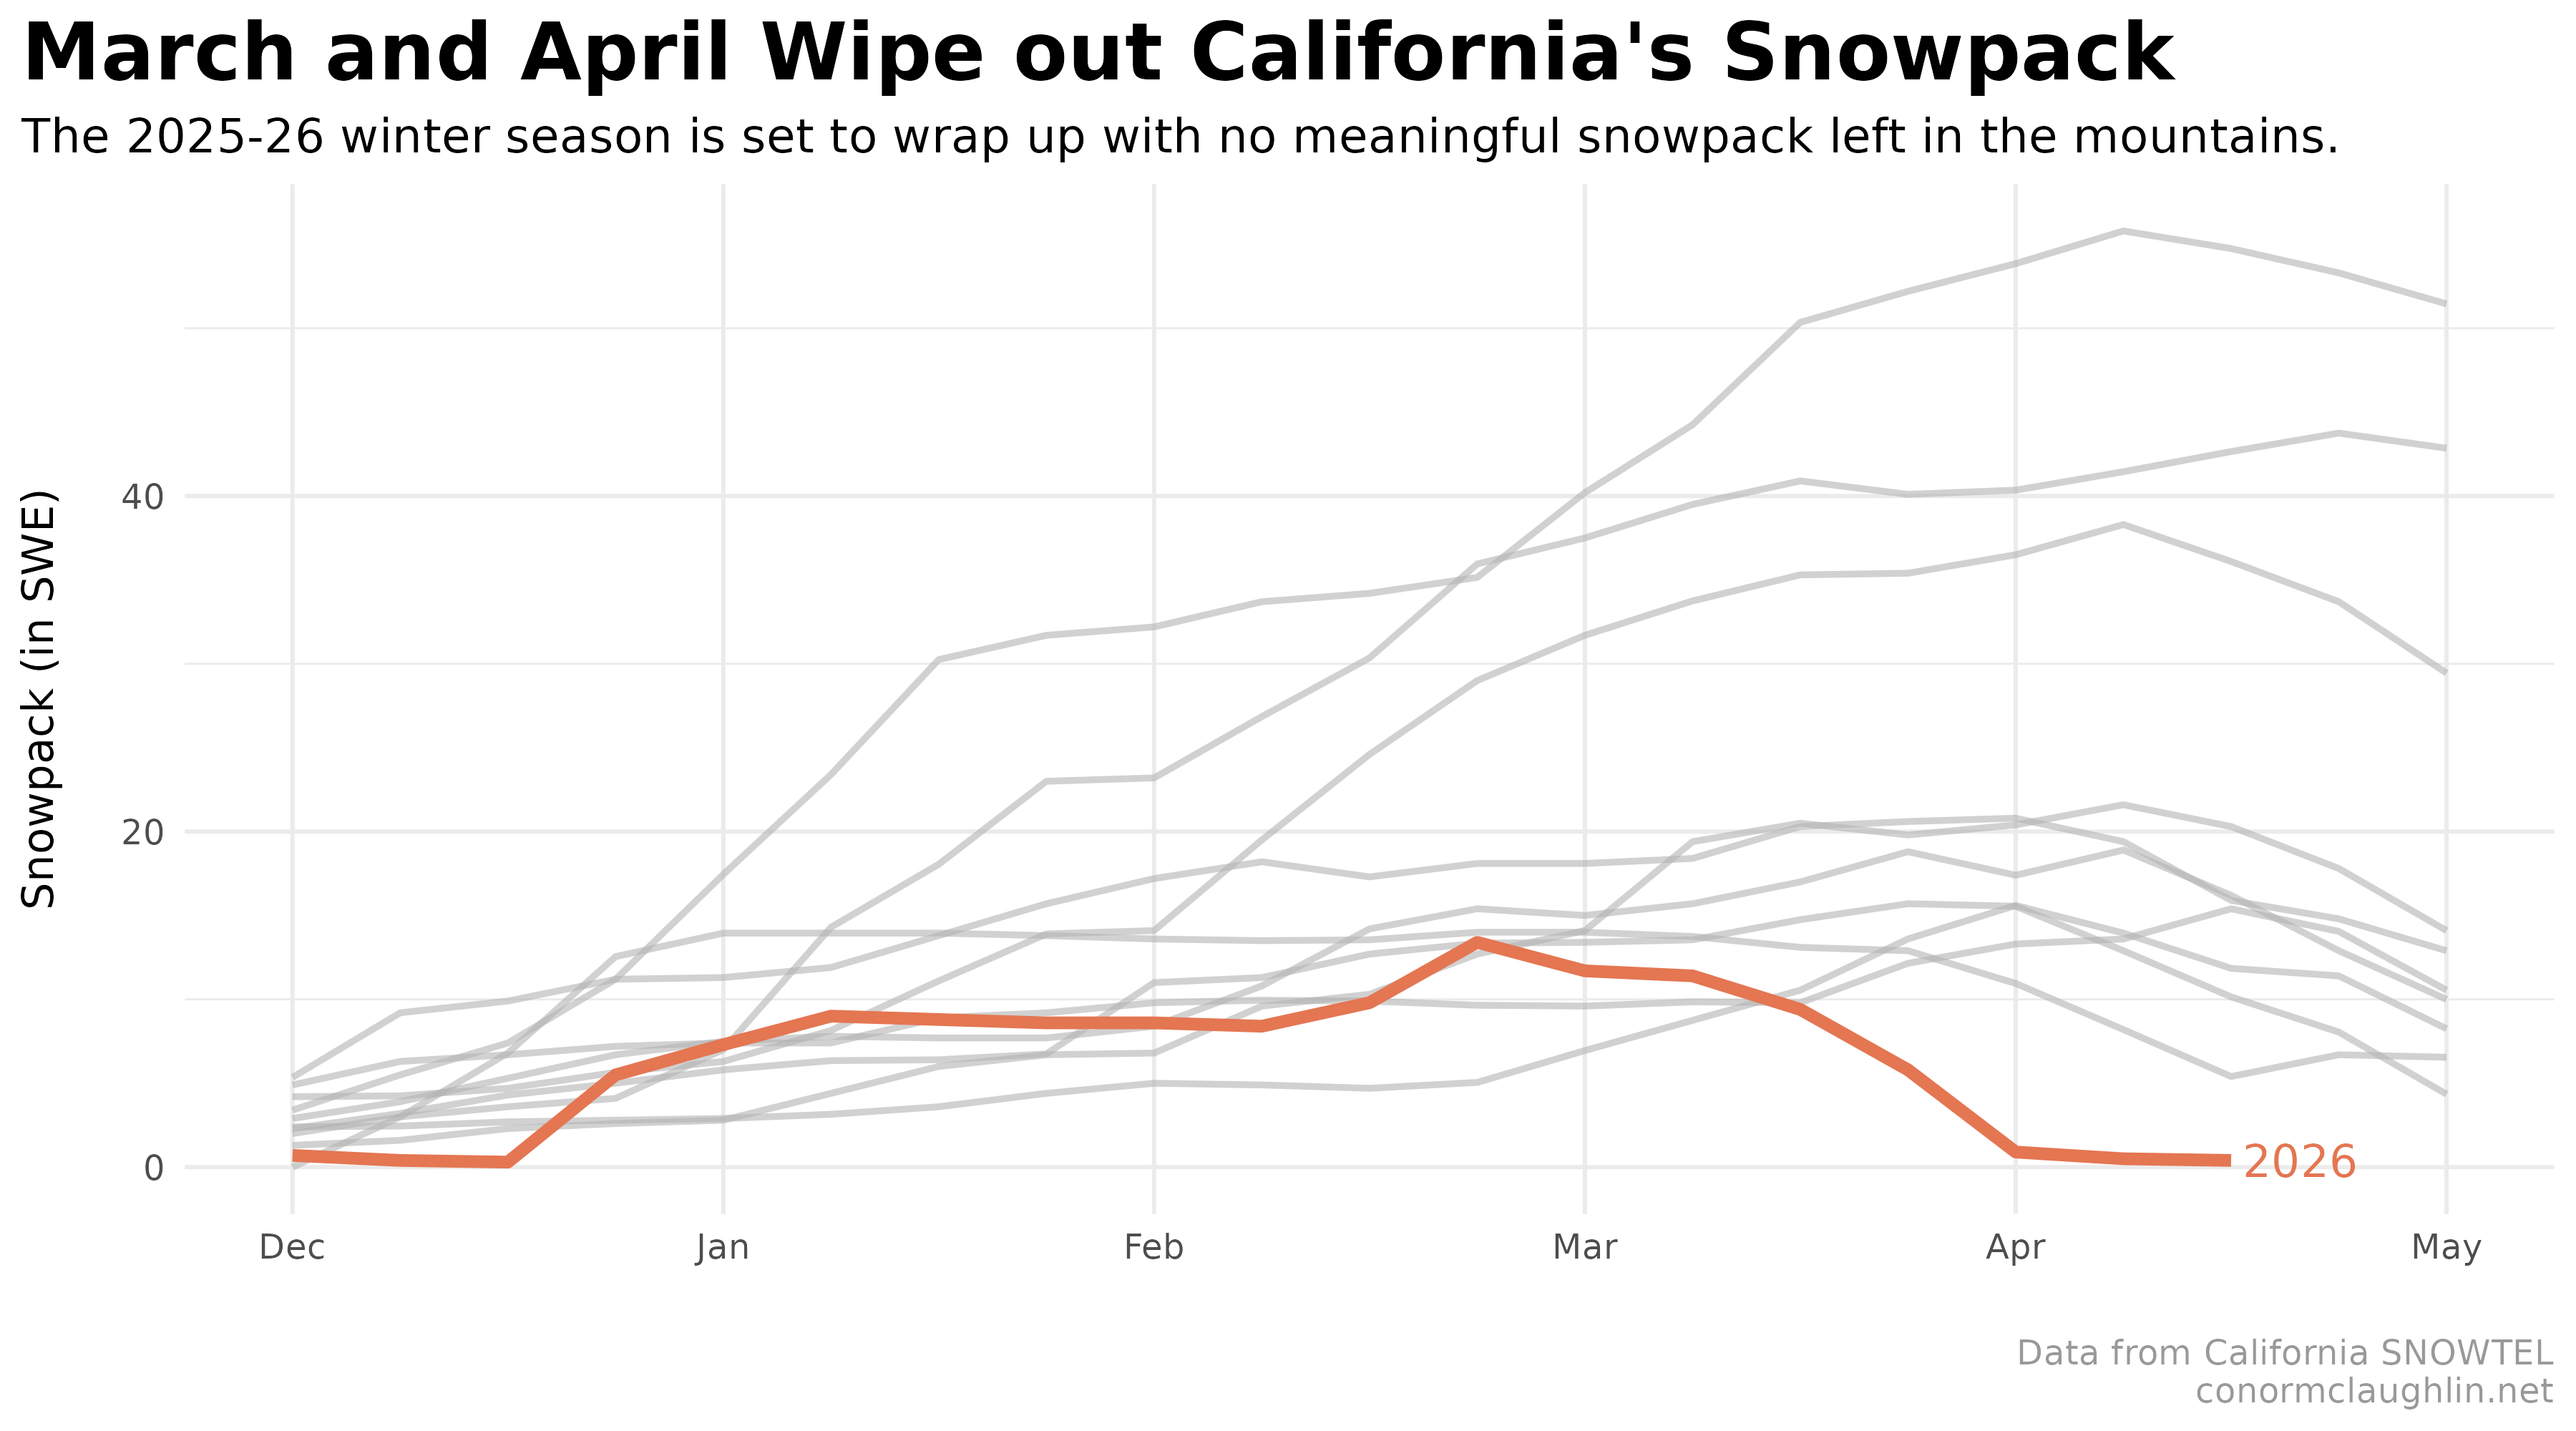
Trending the 2026 Snowpack Against the Past Decade
To cut to the chase: as of April 2026, there is essentially zero remaining snowpack in the California mountains. Plotting snowpack both in absolute terms and also % of seasonal median tells a crystal clear story: a winter that saw mostly normal snow accrual through January and February saw the bottom drop out in March, with nearly all of the snow melted by the heat or washed away by rain.
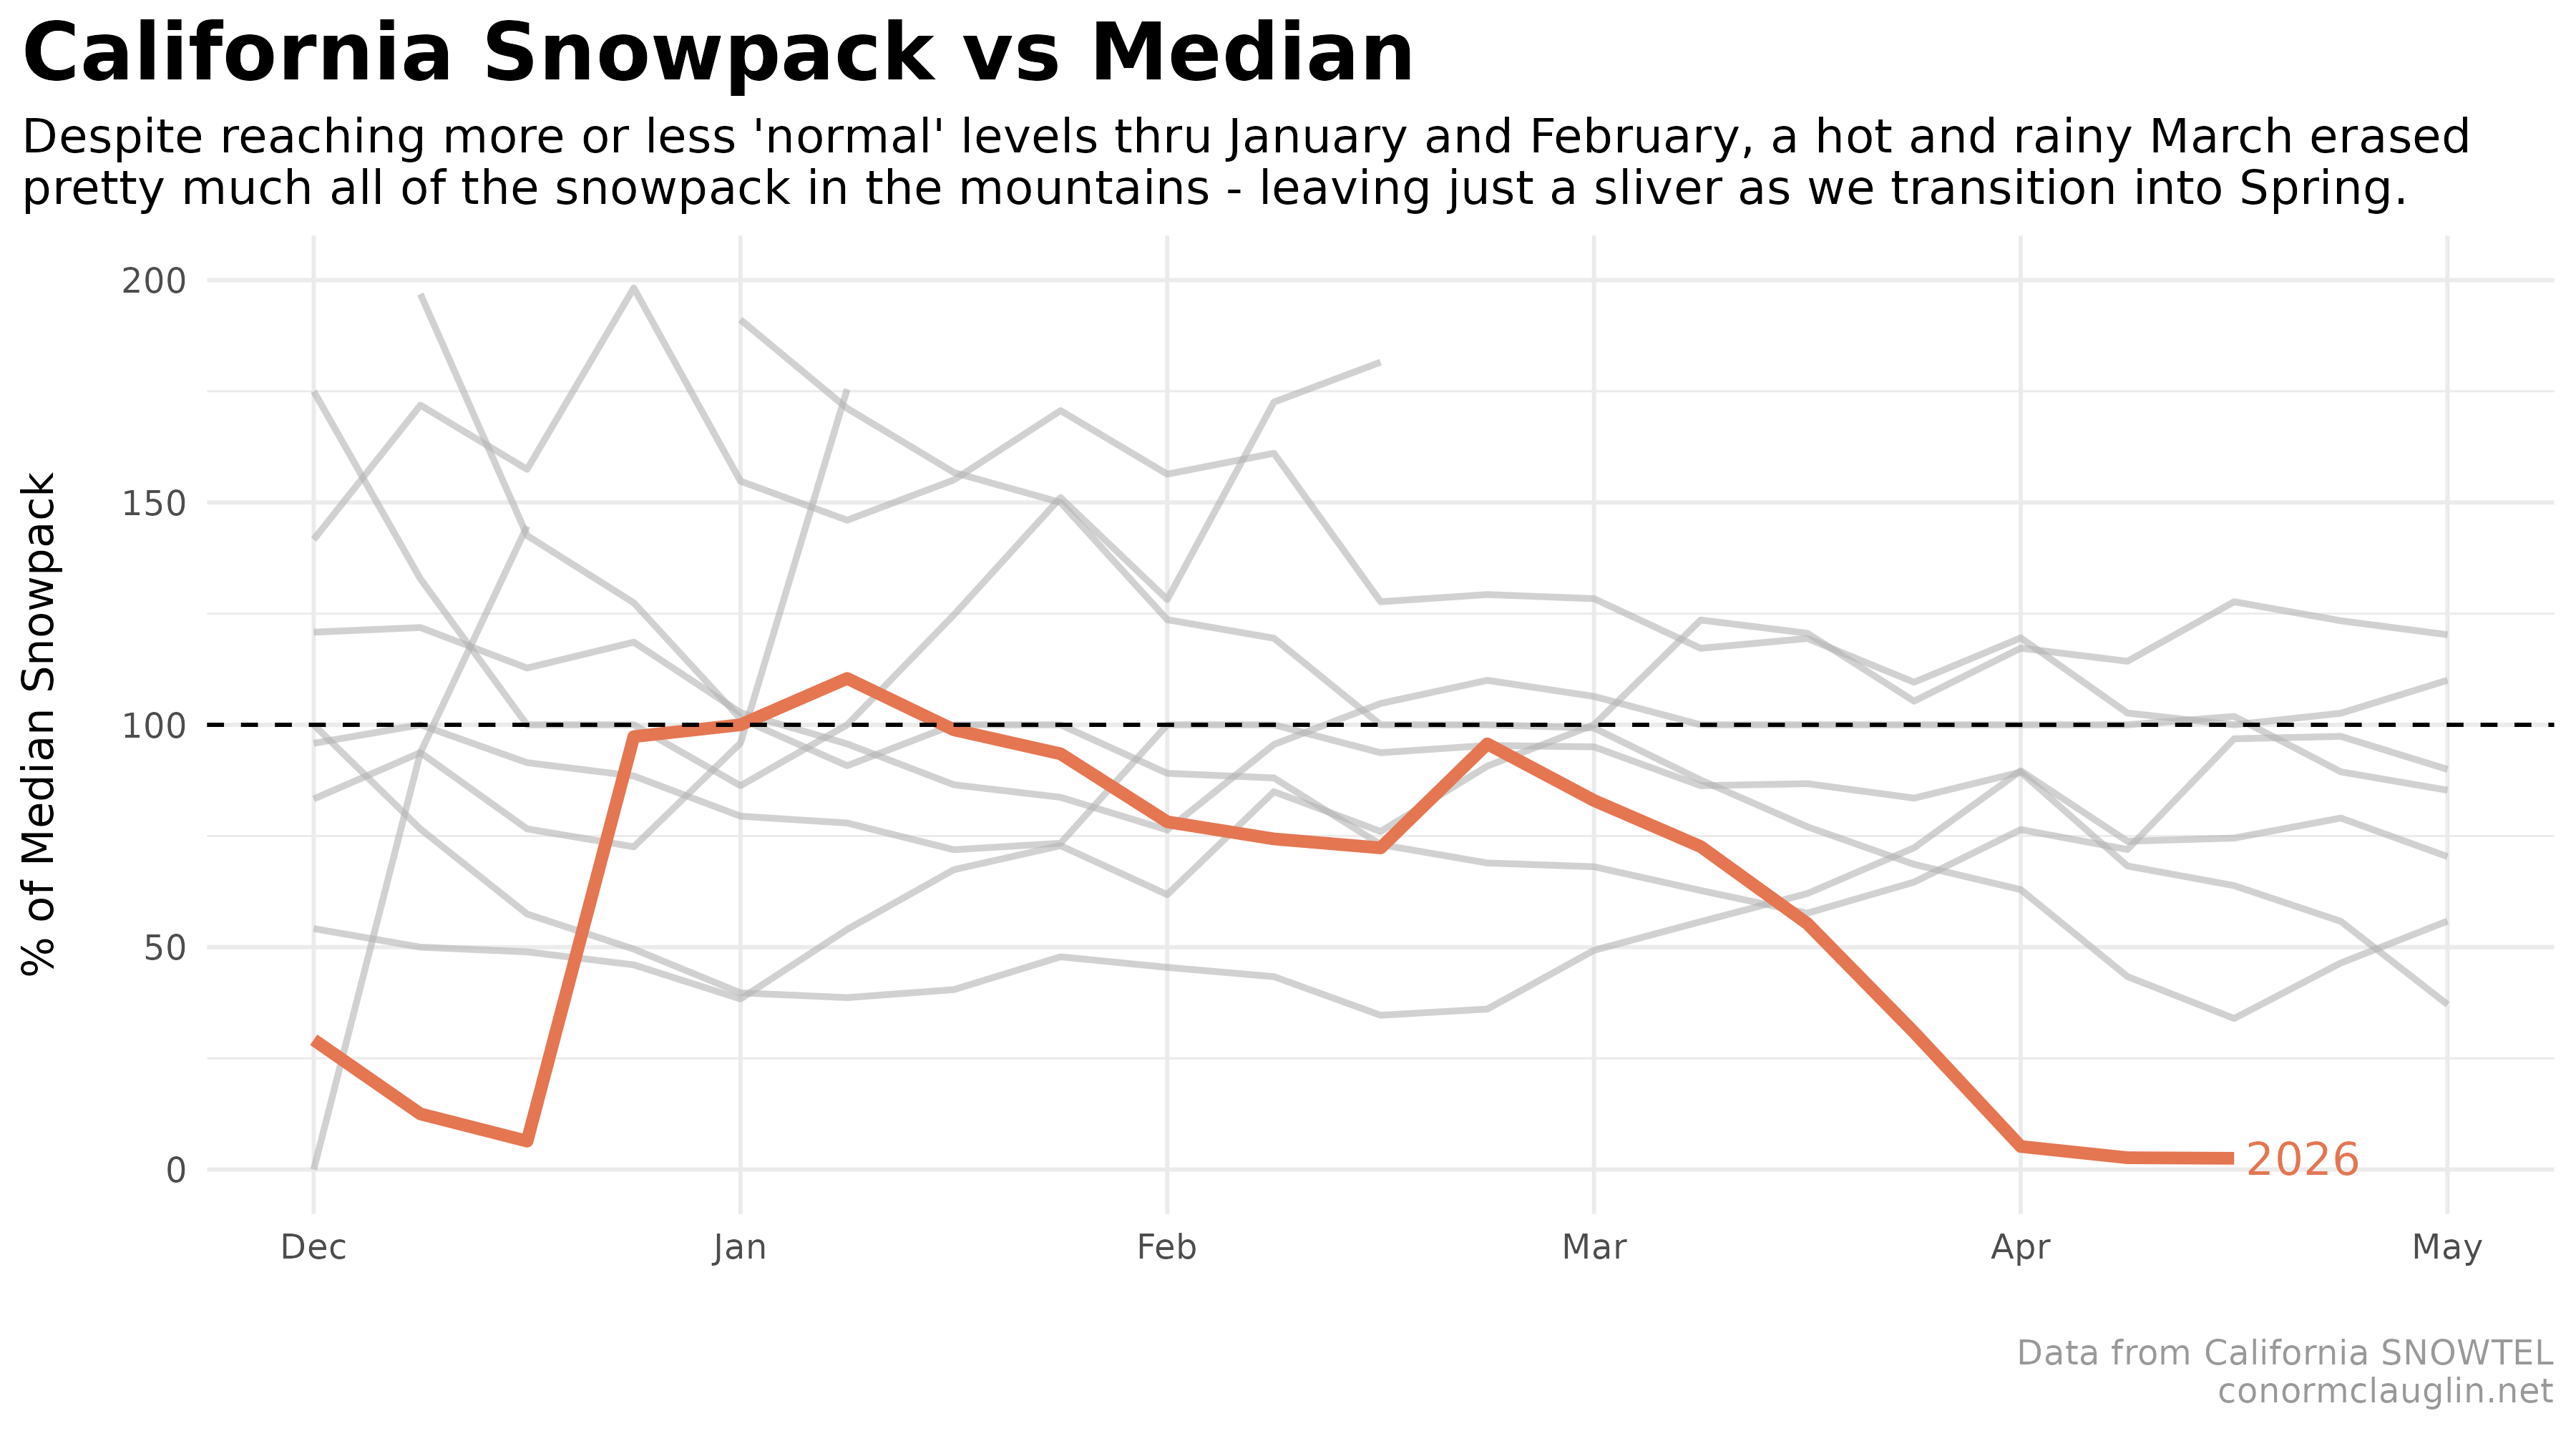
I used SNOTEL’s REST API to put these charts together, stopping a few times along the way to double check I wasn’t missing something - it doesn’t feel good to see figures like 0% of Median. Unfortunately, they are real.
Code Reference
Fetch Snow Stations
base <- "https://wcc.sc.egov.usda.gov/awdbRestApi/services/v1"

get_stations_state <- function(state = "CA", network = "SNTL") {
  req <- request(paste0(base, "/stations")) |>
    req_url_query(
      states = state,
      networkCds = network,
      elements = "WTEQ"
    )

  resp <- req_perform(req)
  txt  <- resp_body_string(resp)
  jsonlite::fromJSON(txt, flatten = TRUE)
}
Fetch SWE for a Station on a Particular Day
get_station_swe_daily_raw <- function(station_triplet,
                                      start_date = "2015-10-01",
                                      end_date   = "2026-09-30") {
  req <- request(paste0(base, "/data")) |>
    req_url_query(
      stationTriplets = station_triplet,
      beginDate = start_date,
      endDate   = end_date,
      elements  = "WTEQ",
      duration  = "DAILY"
    )

  resp <- req_perform(req)
  txt  <- resp_body_string(resp)

  # return raw parsed object first so we can inspect shape
  jsonlite::fromJSON(txt, simplifyDataFrame = FALSE)
}
More than Just a California Thing
While the data I’ve charted above is specific to California, it’s important to note that this trend has hit the entire of the American West: from Nevada to Utah to Colorado… no one was spared.
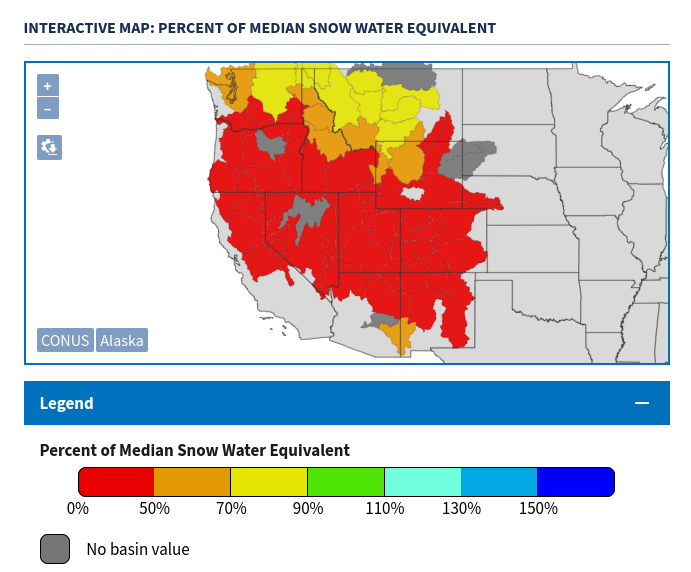
After a few good winters in a row, which helped erase the regions’ persistent drought, things are in a slightly better spot, but I’m still quite worried about what this means for dry season, wildfire risk, and water supplies in general… We’ll have to pray for the best for 2026, and for regression back to the mean in 2027.