Last weekend, I went down to San Diego for my close friends’ annual Kentucky Derby party - reliably one of the most fun weekends of the year. This year was a bit more “mature” than prior years, with the arrival of a few new babies amongst the friend group, but rest assured - there were still plenty of mint juleps consumed and beer die played.
The most interesting part of the day, though, (and the inspiration for this blog post) might have been the half-hour before the race itself: the horse auction.
Mechanics of the Auction
The auction sells off each horse to a member of the crowd, in reverse order of the odds. This year, that meant the 70-1 Oceli was auctioned off first, followed by the rest of the field, and ending with Renegade at 5-1. The payout structure allocates the pot as follows:
- Win: 60% to the winning horse
- Place: 20% to the second-place horse
- Show: 10% to the third-place horse
- Last: 10% to the horse finishing last (must actually finish race)
My friend Tommy and I ended up debating whether bidders should actually factor in the probability of finishing last, which could potentially tip up the price of the worst horses. My slightly contrarian take, which I will stand by, is that the distribution of P(last) is much more uniform than the distribution of P(win) - and that it probably doesn’t make sense to price the P(last) component into one’s bidding strategy in a meaningful way.
The Auction
| Horse | Odds | Amount Paid |
|---|---|---|
| Ocelli | 70-1 | $16 |
| Robusta | 50-1 | $34 |
| Intrepido | 48-1 | $22 |
| 6 Speed | 36-1 | $34 |
| Pavlovian | 48-1 | $26 |
| Albus | 44-1 | $27 |
| Great White | 40-1 | $25 |
| Golden Tempo | 23-1 | $22 |
| Litmus Test | 26-1 | $22 |
| Incredibolt | 25-1 | $37 |
| Potente | 18-1 | $30 |
| Wonder Dean | 25-1 | $31 |
| Danon Bourbon | 14-1 | $37 |
| Emerging Market | 9-1 | $50 |
| Chief Wallabee | 6-1 | $60 |
| Further Ado | 6-1 | $70 |
| Commandment | 5-1 | $66 |
| So Happy | 6-1 | $84 |
| Renegade | 5-1 | $90 |
Bidding Trends
- After a cheap sale of Oceli at $16 to start (valuing the pot at roughly eleven hundred dollars)
- We had a wave of sales for the relatively longshots in the $30ish dollar ballpark
- My thought at the time: people really want a horse to own? and these valuations don’t look good for the later horses
- However, we then saw the “medium” seeded horses go pretty cheaply as a tier:
- Golden Tempo to Wonder Dean all were in the 20ish-1 odds group and sold for the same prices as the longer shot horses from earlier, at $25-30
- At this point, I was like whoa, maybe people have a much more uniform expectation of win probabilities than the betting odds? Or perhaps more likely, they are simply bidding “to have a horse”, and not to optimize their potential earnings from the pool..
- Danon Bourboun and the Emerging Market were where we saw the market make its swing upwards, with the odds crossing under 10-1 and the bidding hitting $50 for Emerging Market at 9-1
- You’ll note though, that the price paid for Emerging Market valued the overall pot at $500, when we use the formula
Implied Pot Value = Amount Paid×(Odds+1) - That means these horses, despite getting more expensive to purchase, are becoming more and more valuable in terms of expected value
- You’ll note though, that the price paid for Emerging Market valued the overall pot at $500, when we use the formula
- The auction closed with the final tier of horses, all valued at 6-1 or 5-1, going between $60 and $90, with a notable premium for the final two horses So Happy ($84) and Renegade ($90)
- If you believe the odds are predictive, then these were all much better bets than the early horses - the prices for these horses would have to double before they no longer represented a “value” versus the first tranche
| Horse | Odds | Amount Paid | Implied Pot Value |
|---|---|---|---|
| Ocelli | 70-1 | $16 | $1,136 |
| Robusta | 50-1 | $34 | $1,734 |
| Intrepido | 48-1 | $22 | $1,078 |
| 6 Speed | 36-1 | $34 | $1,258 |
| Pavlovian | 48-1 | $26 | $1,274 |
| Albus | 44-1 | $27 | $1,215 |
| Great White | 40-1 | $25 | $1,025 |
| Golden Tempo | 23-1 | $22 | $528 |
| Litmus Test | 26-1 | $22 | $594 |
| Incredibolt | 25-1 | $37 | $962 |
| Potente | 18-1 | $30 | $570 |
| Wonder Dean | 25-1 | $31 | $806 |
| Danon Bourbon | 14-1 | $37 | $555 |
| Emerging Market | 9-1 | $50 | $500 |
| Chief Wallabee | 6-1 | $60 | $420 |
| Further Ado | 6-1 | $70 | $490 |
| Commandment | 5-1 | $66 | $396 |
| So Happy | 6-1 | $84 | $588 |
| Renegade | 5-1 | $90 | $540 |
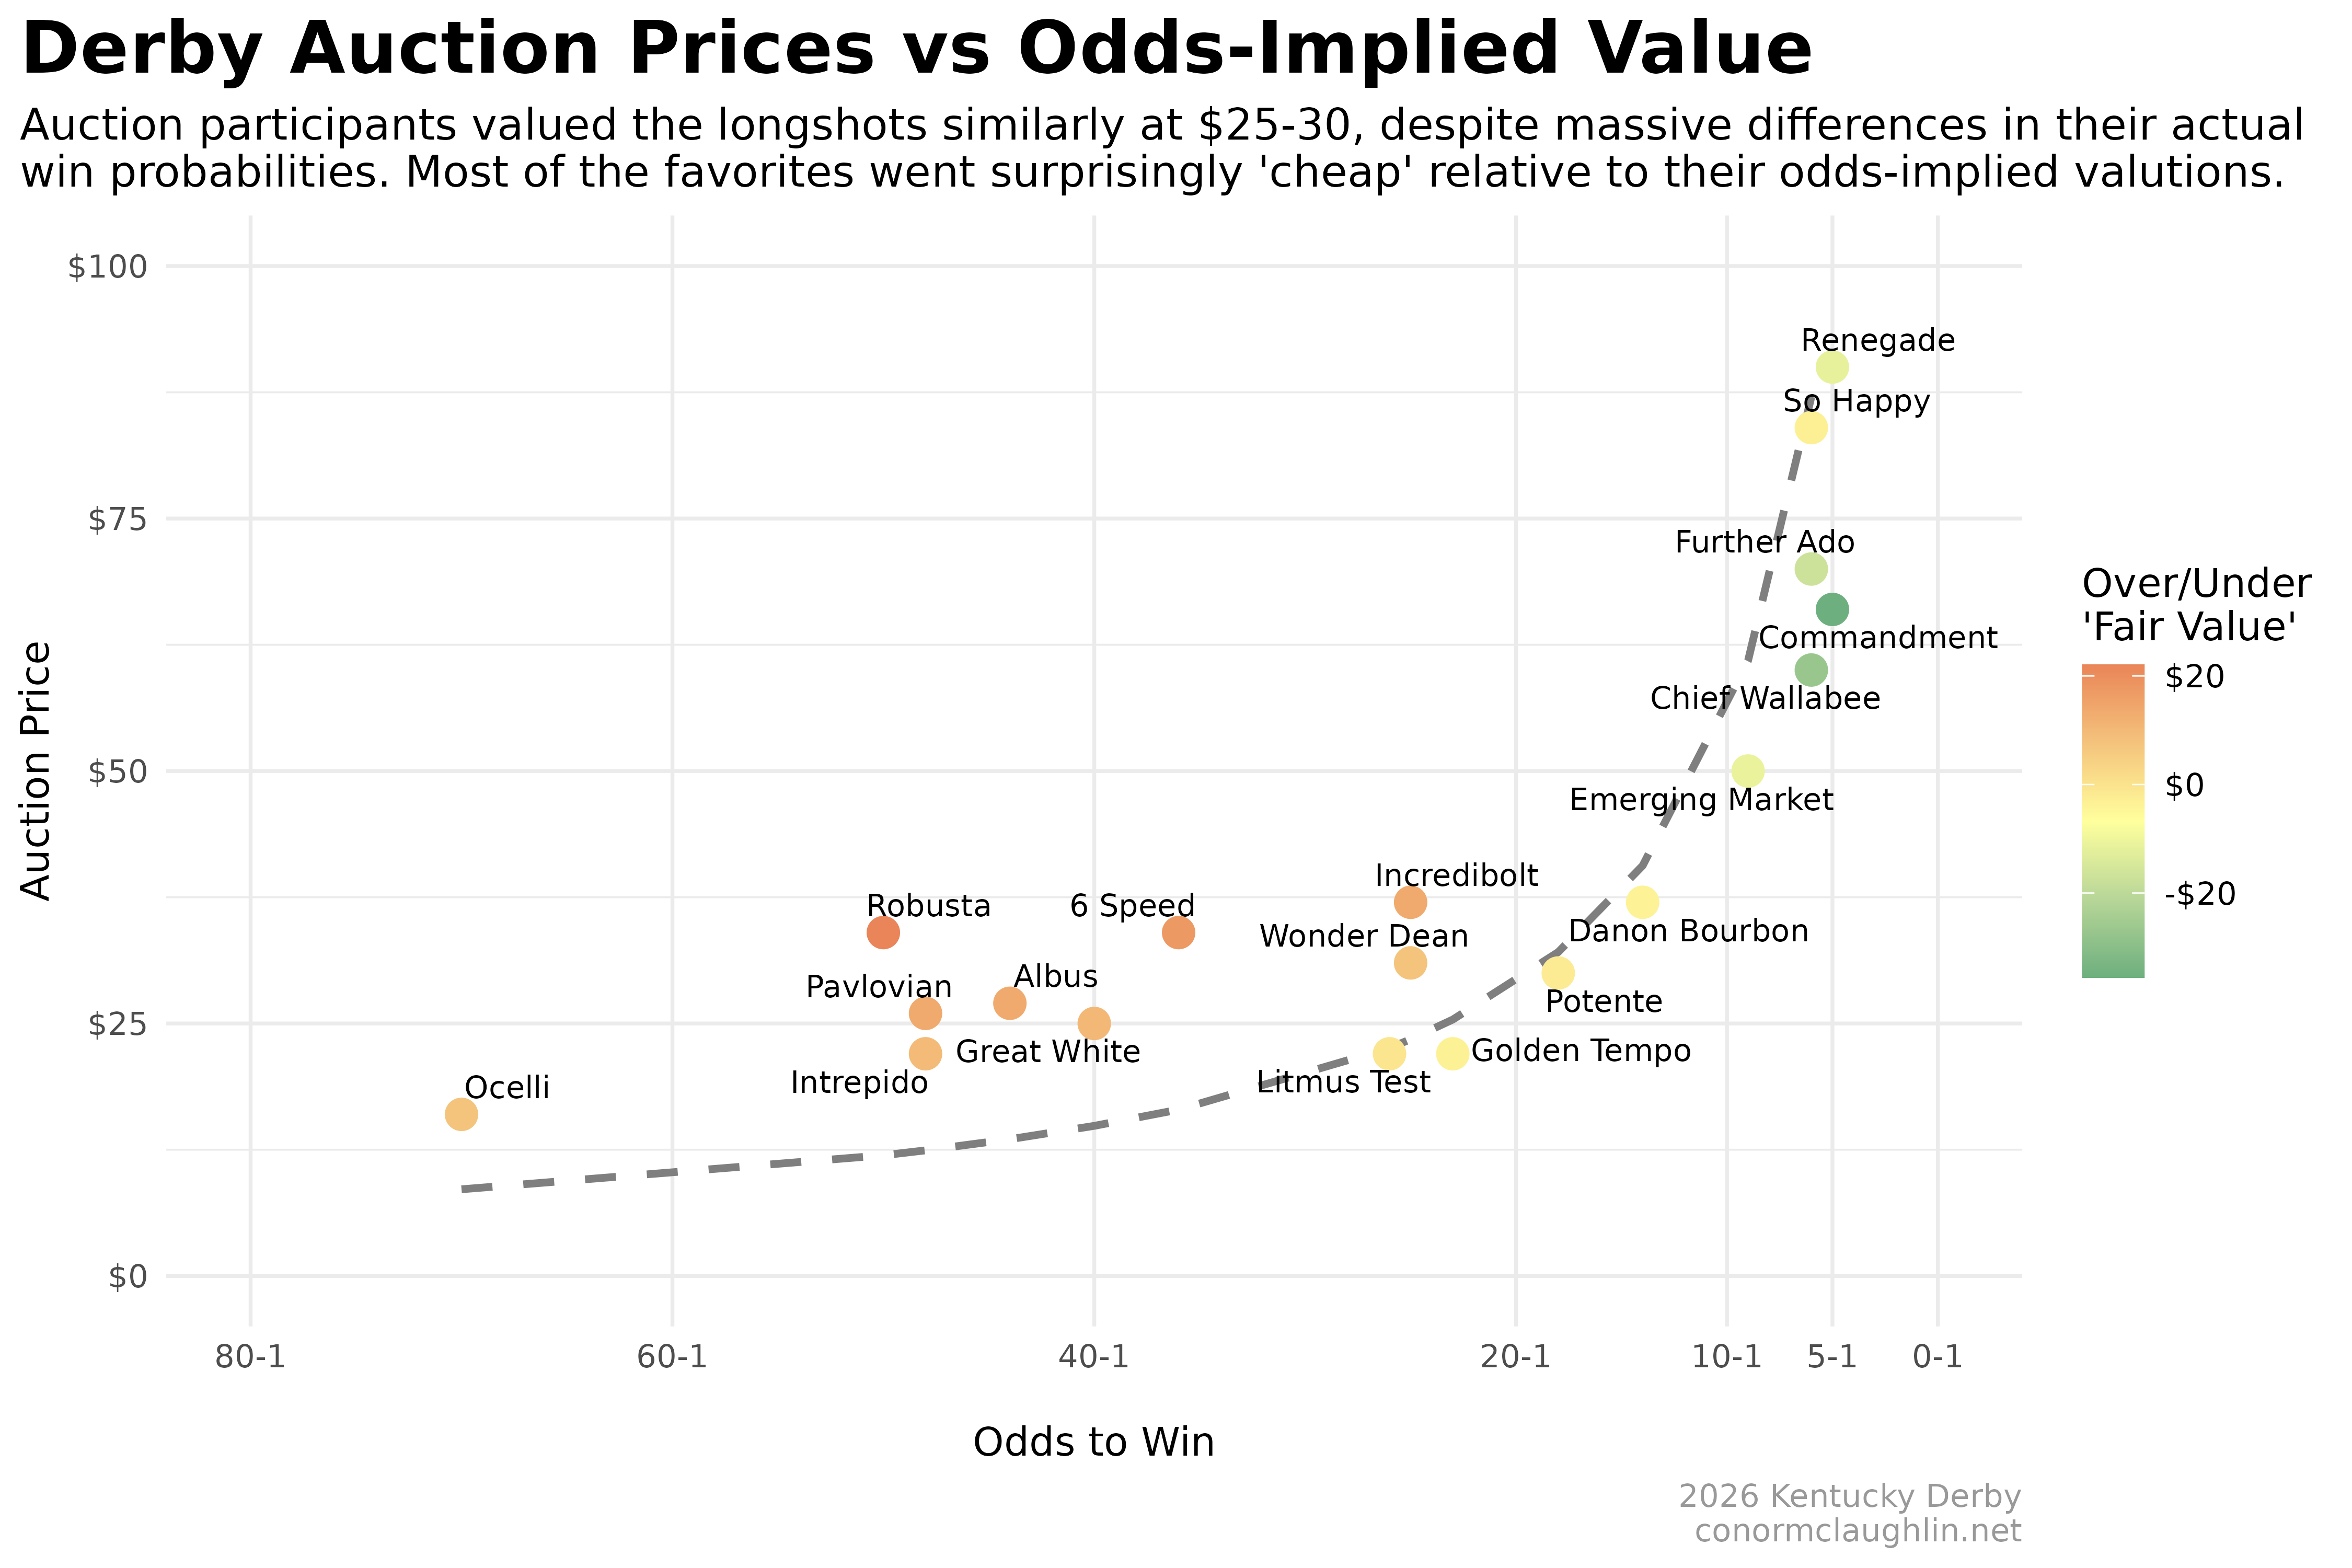
Visualizing the Auction
To pull all of these funny bidding trends into a single graphic, I decided to cook up a rough tradeoff curve between the Odds and the Auction Prices of each horse. A fitted line was overlaid, representing “neutral” or “fair” value for any given Odds, given the total size of the pot at roughly $800.
“Overpriced” horses landed above the line, and “undervalued” horses landed below the line. Intriguingly, the eventual winner Golden Tempo, while not the best value (that would be Commandment, if the odds are to be believed) finished below the line, with a relatively low sale price of $22 given its 23-1 odds.
The Economics
One big point I want to make about this auction is we can’t blame the early bidders for having “poor judgement” - there was simply not enough information available in the bidding market at the times of their bids to know that these initial horses would be “expensive” relative to later horses.
Only with the information available later in the auction, was it apparent that the total pot size was not going to be as big as early rounds projected - which created a feedback loop that served to “brake” the bid sizes for the more expensive horses. This is a classic information asymmetry that comes from sequential auctions format, and is particularly relevant with the payout being contingent on the value of both early and later bids.
In this case, the inflection point that really bent the curve for the auction was the “midrange” (Golden Tempo to Danon Bourbon). At this point, buyers chose not to ratchet up their bids to the degree that early horse valuations would have required. Instead, we had a run of several relatively cheap “solid” horses in a row, which did two things simultaneously:
- It revealed that the early bids were optimistic but not realistic - much better horses went for similar prices
- It revealed that willingness to pay for “better” horses was not as strong as the odds would suggest
- @FederalReserve, recession indicator??
In combination, these factors served to pull down the back half of the auction, as a smaller paid value for the midrange horses lowered expectations for eventual pot size, and the feed-forward of those expectations lowered the amounts bidders were willing to pay for the best chances to win.