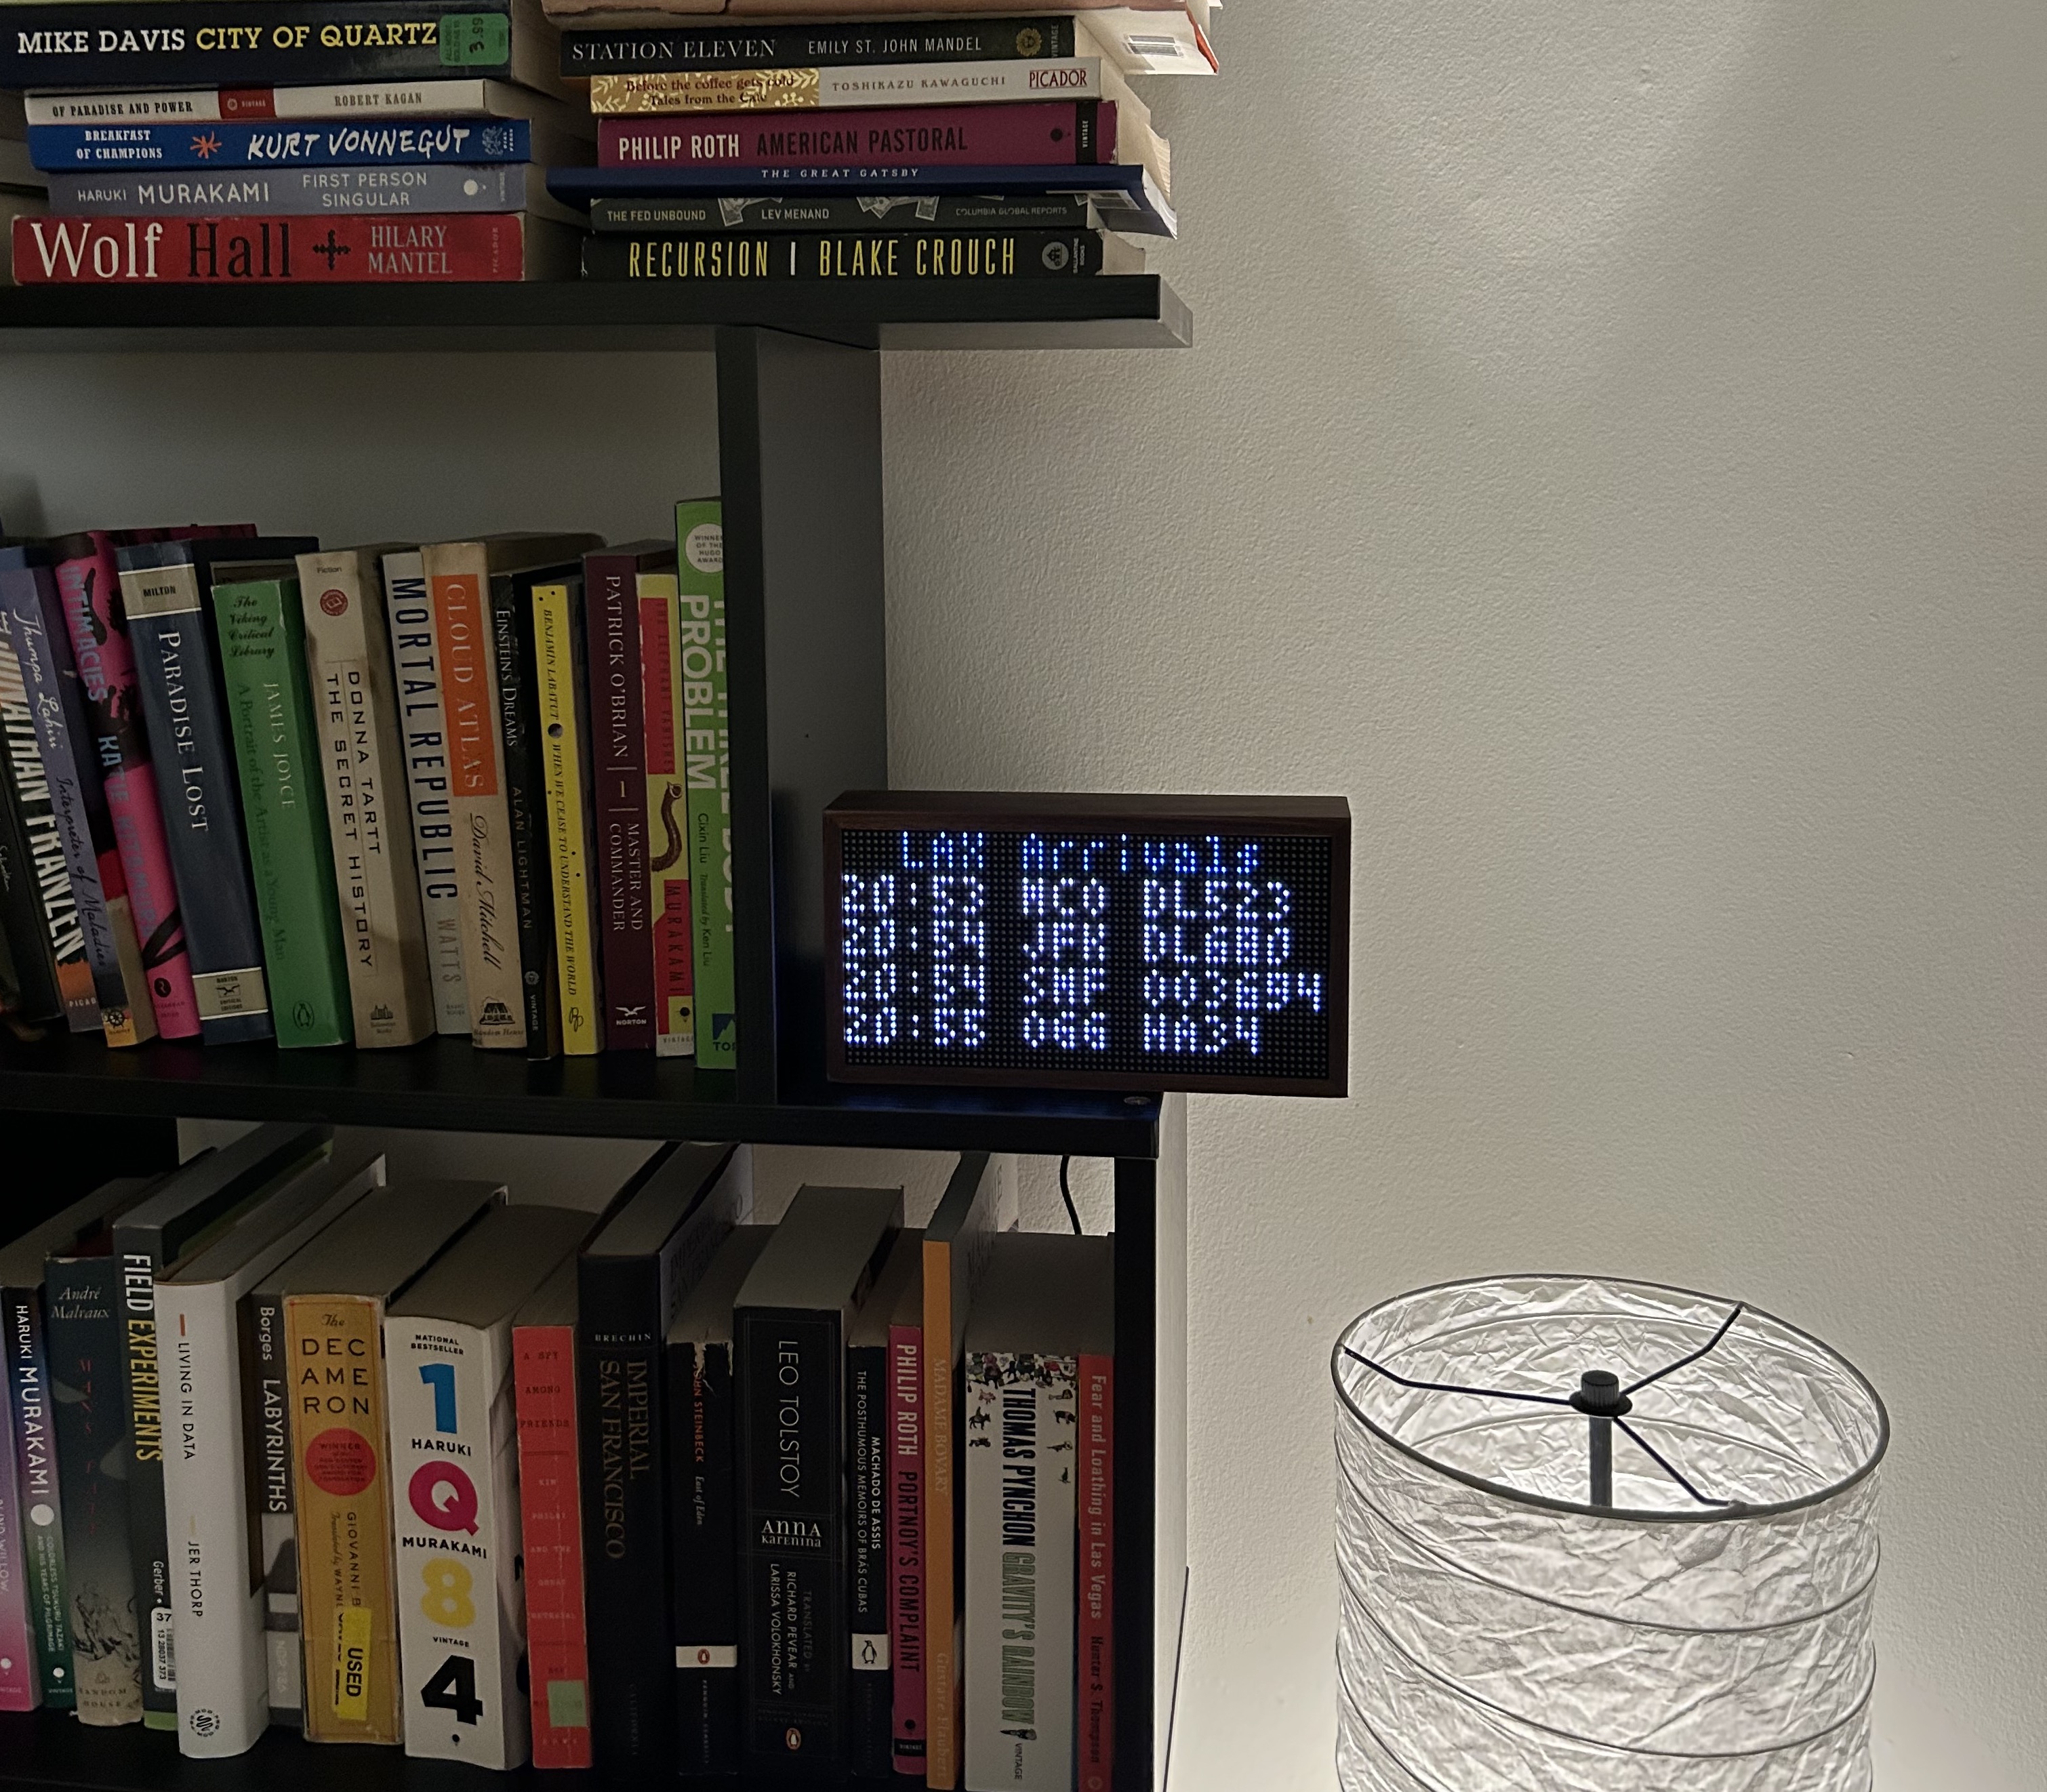
Iteratively Generating Data Visualization Code with ChatGPT


On November 30th, OpenAI released ChatGPT into the world for public use - changing, with the press of a button, the lives of high school students forever 😂

While the OpenAI blog post explains the mechanics of the model better than I ever could, the important thing for readers here to understand is that ChatGPT essentially functions as a more knowledgeable Google - one you can make written requests to and receive back fully fleshed-out answers, which can then be follow-up on conversationally. To that point - Google has allegedly held internal meetings describing ChatGPT to be a “code red” for their search business, with executives concerned that the interactivity and simplicity of ChatGPT could replace many of the queries (and therefore, ad impressions) currently run on Google Search.

Read More

Wait - Tell Me Again How Much the Warriors' Star Studded Roster Is Going to Cost?


Earlier this week, I kicked off a two-part post by describing how the NBA’s multiplier-based luxury tax functions and has been designed to strongly disincentivize teams from spending significantly over the luxury tax threshold. Following up on that post, I wanted to share the example that brought this all to mind - the 2022-2023 Golden State Warriors!

Player Salaries

The Warriors are set to spend $190 million on their 2022-2023 roster, a figure that exceeds the $150 million luxury tax threshold by a whopping $40 million. Data from Sportrac helps us visualize how those funds are allocated across the roster…

Read More

Visualizing the Design of the NBA's Luxury Tax System


Basketball is back! After a long off-season, it was fun to see the league back in action last night, with a great game between the Celtics and Sixers followed by the Warrior’s ring ceremony and easy win against the Lakers.

Seeing the Warriors’ roster all together (bruises and all), with the recently extended Jordan Poole and Andrew Wiggins reminded me what a talented (and expensive) group they’ve put together this season, and got my mind churning on something…

Read More

Analyzing Dealer Markups of Popular New Cars


Over the past year and a half, new cars have become dramatically more expensive. While changes in product mix, constraints in part supplies, and overall increases in quality have played into that, dealer markups have also become a prominent factor - especially with highly-demanded models.

New Car Price Index

Economic Background

With exciting cars like the Ford Bronco and new Corvette having hit the market, dealers have found themselves in an interesting position - sole vendors of an in-demand good, with limited supply. It doesn’t take an Econ major to see the outcome here -> dealers have been able to apply “market adjustment” fees on top of MSRP (crucially - which enough people will still pay!) to maximize their earnings per sale, much to the chagrin of their OEMs.

Read More

Which MLB Teams Travel the Most?


I recently took a trip to Europe - an amazing time - but with the long flight to and from the West Coast, found my body really paying the price in terms of jetlag.

One of the nights after my return to California, as I lay awake at 5 am, body still mostly on Spain time, I realized that professional sports teams are doing a small-scale version of this every few days: flying from Oakland to Houston to Seattle and back, then hitting the road again.

Read More

What are the Chances Aaron Judge Can Surpass Roger Maris' AL Home Run Record?


In the first 111 games of the Yankees’ season, Aaron Judge has played in 107 games, walked into the batter’s box 475 times, and taken an MLB-leading 44 nice, slow jogs around the basepaths.

That astounding production has put Judge into rarefied air, as a strong contender to finish the season with 60 or more home runs, and a chance at beating Roger Maris’ long-held AL record. If Judge can hold pace through August, the final month of the season may turn into appointment viewing as he closes in on his 61st and 62nd homers, tying and surpassing Maris, respectively.

Read More

How Rising Interest Rates Constrict Home Affordability


With inflation continuing to run hot across many sectors of the economy, the Federal Reserve has begun to raise interest rates, and seems set to raise them another 50-75 basis points in the coming days.

The purpose of these rate hikes is to kickstart the cooling process within the economy by constricting capital expenditure, which slows associated business and consumer spending, which then (hopefully) begins to restore price stability - all without (the Fed hopes) impacting the labor market too much. It’s a super delicate needle to thread, and it will be fascinating to see whether or not this approach ends up being an effective one, or if it becomes increasingly clear that the Fed’s response to inflation has been too little, too late.

Read More

How Much Does it Cost to Charge an Electric Vehicle (EV)?


If you’ve driven your car at all over the last few months, you may have encountered some shockingly high numbers at the gas pump. I know I certainly have - take a peek at this bill I paid last month at a particularly pricey gas station in Brentwood!

How Much Does it Cost to Charge an Electric Vehicle (EV)?

While I don’t drive enough for these prices to be materially painful, it is still no fun to pay a bill of that size!

Read More

Home Run Differential Through the Opening Months of the 2022 MLB Season


It’s been another painful year to be a Washington Nationals fan. Fresh off a 3-0 series drubbing by the red-hot Atlanta Braves, they lost again today to the Philadelphia Phillies, leaving them with a 2-8 record in their last 10 games, and 19.5 games back of the Mets for the NL East lead.

I write, however, prompted not so much by the continued pains of the Nats (though each Corbin start does wound me deeper and deeper), but by the clearly evident skill of the Atlanta Braves - who hit thirteen home runs in their three game sweep.

Read More

Comparing Positional WAR Projections (2022)


In the leadup to Opening Day, Fangraphs published a series of “Positional Power Rankings”, which sought to measure how each team’s roster stacks up against others in the league, at each position.

The final rankings were computed two ways:

  1. Creating an ordinal list of teams, sorted by projected WAR at that position (ie. 1, 4, 12)
  2. Creating a z-score for projected WAR at each position (ie. +2.35, -0.76)

While method one is handy to quickly check relative position in the rankings, it doesn’t do a very good job of capturing how significant the differences are… For example, Juan Soto isn’t just the best right fielder, he is projected to be a lot better than the second best right fielder. As such, visualizing this data with z-scores of projected WAR gives us a more intuitive sense of the spread of the data, in addition to the ordinal rankings.

Read More